


ONLINE MAGAZINE ISSN 2150-5128
VOL. 4 / NO. 1 INTERACTIVE PDF ![]()
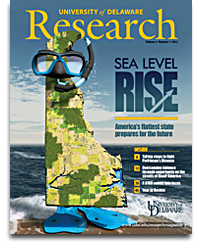
Delaware is called the “First State” for being the first to ratify the Constitution, but it also ranks “first in flatness.” Delaware has the lowest mean elevation of all the U.S. states, at 60 feet. Its elevation ranges from sea level at the ocean beaches to nearly 448 feet above sea level on Ebright Road, near the Pennsylvania state line.

Delaware ranks as the second smallest state in size, with a total area of 1,982 square miles. The state is 96 miles long and ranges from 9 to 35 miles wide.

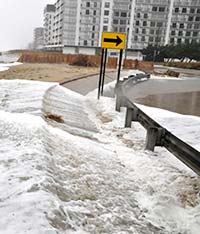
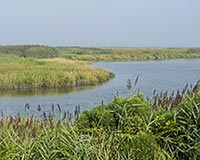
Delaware lies within a sea level rise “hotspot” where sea levels could rise faster and higher than elsewhere due to a combination of rising seas and sinking land. Sea level rise at Bowers Beach, Del., is climbing at a rate faster than anywhere else on the Atlantic coast.
Sources: DNREC, Delaware Geological Survey, U.S. Geological Survey

Although the Delaware coast lost sizable swaths of sandy beach, and some homes were swamped, the state largely dodged a demon named Sandy in October, as the freak storm saved its hardest punches for the New Jersey and New York coasts.
Yet the superstorm’s path of destruction along the East Coast has raised new questions and concerns about climate change, extreme weather, rising seas and what may lie ahead—a “new normal”—as UD’s Gerald Kauffman refers to it.
By the end of this century, 8 to 11 percent of Delaware could be underwater based on the state’s sea level rise planning scenarios of 0.5 meters (1.6 feet) and 1.5 meters (4.9 feet), respectively.
Source: Delaware Department of Natural Resources and Environmental Control (DNREC)
All of us—consider the infrastructure needs and costs as homes, businesses, highways, bridges and dams risk being submerged, and people are displaced; the potential impacts on the cities and historic communities that give Delaware its character; the loss of wildlife and more.
Is Hurricane Sandy the latest harbinger of climate change? Scientists point out that it is nearly impossible to associate a single meteorological event to climate change.
But what scientists do know, says Kauffman, who directs the Water Resources Agency at UD, is that sea levels have risen about 13 inches along the Delaware coast in the past century and continue to rise. The East Coast is a world hotspot for rising sea levels, and higher seas will only compound the impacts of future storms.
Kauffman is among several UD representatives who serve on the Climate Change Vulnerability Steering Committee convened by the Delaware Department of Natural Resources and Environmental Control (DNREC). Other UD faculty are on a state committee that has assessed Delaware’s vulnerability to sea level rise. That assessment, released by DNREC in September 2012, will guide adaptation strategies.
Delaware, the lowest state in elevation in the U.S., is standing tall in preparing for sea level rise. According to the state’s vulnerability assessment, 8 to 11 percent of Delaware could be underwater by 2100. Those percentages are based on sea level rise scenarios ranging from the conservative to the more aggressive, of
0.5 to 1.5 meters (1.6 to 4.9 feet), respectively. In either scenario, at stake would be acres of beach and marsh and thousands of homes in communities that give the state its character.
“Delaware has been the envy of other states for mobilizing to identify the risks and plan for the future,” Kauffman says.
“Sea level rise will affect everyone—not just communities preparing for storms,” he warns. “It will affect what we pay in taxes, where and how we build our homes and highways, the places we work, our food and water, the wildlife around us and the recreation services we enjoy.”
What research is UD bringing to bear on such issues? Read on.
Delaware and Maryland teachers will have new resources to integrate climate change science into the classroom, thanks to a multimillion-dollar initiative funded by the National Science Foundation (NSF).
The $5.8-million cooperative agreement supports implementation of the Maryland-Delaware Climate Change Education, Assessment, and Research (MADE CLEAR) partnership, an effort to forge new ways to deliver effective, relevant climate change education in grades 8–12 that could serve as a national model.
The partnership brings together experts in climate science and education, led by the University System of Maryland and UD, to provide a support system for teachers in the two states. The network also will engage universities, state departments of education, and educators from natural resources agencies, museums and aquariums.
“MADE CLEAR will connect Maryland and Delaware students and citizens with the world in which they live by fostering a greater understanding of why the climate is changing and the consequences within our two states,” said program director Donald Boesch, president of the University of Maryland Center for Environmental Science. “Our goal is to provide a basis for our citizens, today and tomorrow, to make individual and collective choices for limiting the magnitude of climate change and adapting to its consequences.”
Climate change is a complex, sensitive topic to teach, touching on economic, social, political and scientific issues to a greater degree than most science topics. The partnership encourages scientists and educators to work together to ensure scientific objectivity and accuracy in the classroom and promote critical thinking.
Rather than introducing climate change science as a new subject in an already crowded curriculum, the goal is to integrate understanding of climate change within new science standards and environmental literacy requirements in Maryland and Delaware schools.
“As the world around us changes in many ways, it’s important that educators stay current with cutting-edge science,” said Delaware Gov. Jack Markell. “This partnership provides a way to engage and inform the teachers who will be instructing the emerging workforce for jobs of the future.”
Nancy Targett, dean of UD’s College of Earth, Ocean, and Environment, noted, “The goal is for students to emerge with better knowledge of the science behind climate-related issues. They can then better understand implications for our health, coasts, water supplies, farms and forests.”
MADE CLEAR brings together scientists from the University System of Maryland and UD, plus Delaware State University and Towson University, who are engaged in climate change research, from atmospheric physics and chemistry to ecosystem and human health effects. This expertise is already being used by state and federal governments and businesses to understand future climate change impacts on their assets, people and ecosystems.
Also key is the participation of the Maryland State Department of Education, the Delaware Department of Education, Maryland Public Television and state and federal science agencies, including the state departments of environmental and natural resources, National Aeronautics and Space Administration and National Oceanic and Atmospheric Administration.
“MADE CLEAR will support the development and distribution of teaching approaches and materials, and evaluate their effectiveness,” said Nancy Brickhouse, interim provost and professor of science education at UD. “In that way, we can strive not only for continuous improvement in our two states, but be a model for the nation.”
MADE CLEAR is one of six Phase II projects funded through NSF’s Climate Change Education Partnership (CCEP). The program’s vision is a scientifically literate society that can effectively weigh the evidence regarding global climate change as it confronts the challenges ahead, while developing the scientific workforce to advance knowledge of human-climate interactions and develop approaches for a sustainable, prosperous future.
This one-time, dedicated NSF program aims to establish a coordinated national network of regionally or thematically based partnerships devoted to increasing the adoption of high-quality educational programs and resources related to the science of climate change and its impacts.
By tracey bryant
Office of Communications
& Marketing
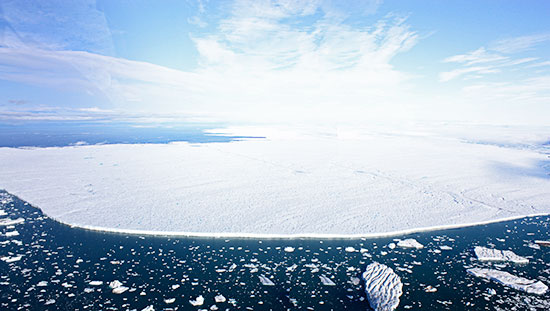
The extent of sea ice in the Arctic reached a record low in 2012, according to the U.S. National Snow and Ice Data Center (NSIDC).
Andreas Muenchow, a University of Delaware marine scientist, confirmed some of that ice loss firsthand while doing research off Greenland from aboard the Canadian icebreaker Henry Larsen this past August. He produced a short video that shows the ice-free sea off Petermann Fjord in which the ship was sailing — an area that previously, for ages, had been covered by floating ice shelves.
“But it is no more,” notes Muenchow in the video. He and his research team from UD’s College of Earth, Ocean, and Environment (CEOE) were working in Nares Strait, between Greenland and Canada, to recover an ocean and sea ice observing array they had moored there in 2009 as part of his National Science Foundation research project.
“What we see in Nares Strait is some of the hardest and thickest ice leaving the Arctic with some of it being replaced by much thinner ice that has not been hardened by many sequential freeze/melt cycles,” said Muenchow, an associate professor in CEOE’s School of Marine Science and Policy.
“The harder thicker ice is called ‘multi-year’ ice, distinct from first-year ice. The slow disappearance of this multi-year ice from northern Canada and Greenland is one major factor causing the ice extent to become steadily smaller over the last 40 years or so. Most climate models predicted this scenario, but we are 30 to 40 years ahead of the predicted schedule with regard to the ice cover in the Arctic,” Muenchow says.
According to NSIDC, the extent of Arctic sea ice on Aug. 13 was 1.97 million square miles. That figure was 1.04 million square miles below the 1979 to 2000 average extent for the date, and 186,000 square miles below the previous record low for the date, which occurred in 2007.
On his expedition, Muenchow observed Petermann Glacier and the island of ice, twice the size of Manhattan, that broke off from it on July 16, which weeks eariler he had confirmed from his UD office using satellite data and had reported in his “Icy Seas” blog.
On Aug. 24, while still in the Arctic, Muenchow blogged that another ice island—about three times the size of New York’s Central Park—had broken off from nearby Steensby Gletscher.
The instruments Muenchow recovered are now yielding data on currents, temperature, salinity and ice thickness recorded at better than hourly intervals since 2009, including passage of the “superchunk” four times the size of Manhattan that broke off Petermann Glacier in 2010.

By Diane Kukich College of Health Sciences
That’s how many single family homes, apartments and manufactured homes Delaware could lose to rising waters by the end of this century, according to the Delaware Sea Level Rise Vulnerability Assessment. This report, announced by the Delaware Department of Natural Resources and Environmental Control in September 2012, outlines the potential impacts under various sea level rise scenarios to homes, businesses, farmland, roads, parks, wetlands and more. Download it at de.gov/slrva.
According to the Delaware Sea Level Rise Vulnerability Assessment, rising seas also could inundate thousands of septic tanks, over 135 wastewater pumping stations and treatment facilities, and more than 50 brownfield sites in Delaware, presenting a variety of public health risks.
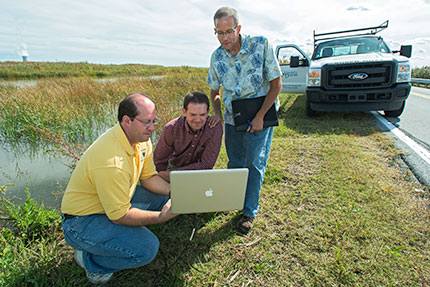
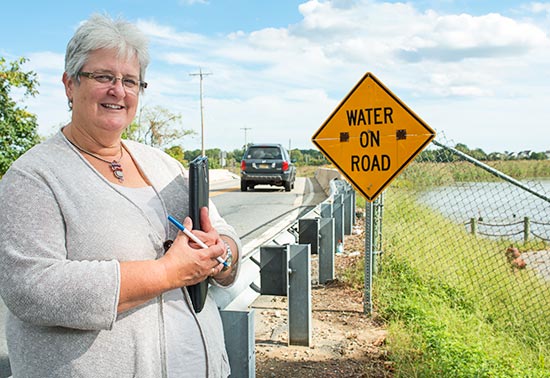
On Mother’s Day of 2008, high tides, strong northeast winds and heavy rains left a handful of tiny communities along the Delaware Bay in Kent County under several feet of water.
The storm left in its wake one fatality, dozens of people homeless and more than $1 million in property damage, but it also prompted state officials and University of Delaware researchers to put their heads together to develop an early warning system for coastal flooding to facilitate planning in the future.
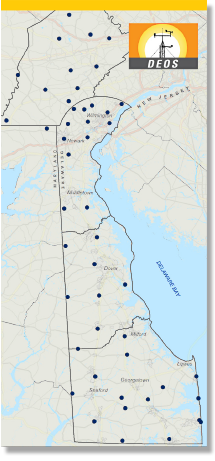
The result was an alert notification system and website displaying pertinent information regarding forecasted local water levels. It initially focused on six coastal communities along the Delaware Bay—Leipsic, Little Creek, Pickering Beach, Kitts Hummock, Bowers Beach and Slaughter Beach—for testing the system, but it has since been expanded.
Launched in 2011, the Coastal Flood Monitoring System (CFMS) supports planning and emergency management for Delaware Bay communities before and during coastal storm or high tide events. It was developed by John Callahan, a research associate for the Delaware Geological Survey (DGS), and Kevin Brinson, a researcher for the Delaware Environmental Observing System (DEOS). The Delaware Department of Natural Resources and Environmental Control and the Delaware EPSCoR program funded the project.
The CFMS includes several elements:
All the information is tailored to specific locations, so an official from Bowers Beach, for example, can look at inundation maps and use them to make decisions about evacuating residents or calling in rescue crews.
“Delaware has coastal flooding issues just about every time there’s a major storm, and, with increases in sea level, we have the potential for these incidents to occur more frequently,” says Dan Leathers, professor of geography in UD’s College of Earth, Ocean, and Environment and Delaware state climatologist. “The monitoring system won’t alleviate flooding, but it can help us better prepare for the effects of coastal flooding on people and property.”
Callahan points out that in coastal Kent County, the roads are barely above water under normal conditions.
“Let’s say it’s high tide and we get just a small amount of onshore wind—that’s all it takes to cause flooding in this area,” he says. “That’s why displaying the road profiles on the website is an important feature for planners and rescue personnel as they try to answer questions like ‘Can we get a fire truck through or do we need to use boats to get people out?’ ”
The team currently is working on the next generation of the system that will go as far north as New Castle and as far south as Lewes. It will feature increased quality and resolution of forecasts, an improved alerts system and a new web interface.
Leathers explains that expansion of the system to other areas of the state involves much more than just extending its geographic boundaries. “We have to consider different hydrodynamic issues in each of these areas,” he says.
While the monitoring system provides a service to coastal communities, it is also firmly grounded in research. The team is comparing model predictions with actual behavior to improve system accuracy.
They also have started taking measurements in preparation for creating a similar system for Delaware’s Inland Bays, which are influenced by different climatic and hydrodynamic phenomena.
Leathers applauds the state for the support they give to DEOS and DGS researchers.
“There’s a lot of environmental observation going on in the state, which really helps with projects like this,” he says. “There are more monitoring stations here than there are in many states much larger than Delaware.”

Hurricane Sandy set nine high tide records in Delaware.
Delaware
Geological
Survey
Office of Delaware State Climatologist
When a weather emergency threatens Delaware, the Office of the Delaware State Climatologist and the Delaware Geological Survey (DGS), both based at UD, are integral members of the team that rallies to deal with the potential crisis.
Whether it’s a hurricane, nor’easter or major snowstorm, weather emergencies in the First State usually prompt concerns about flooding, and that’s where these offices come into the picture.
In the case of an impending hurricane like Sandy in October 2012, the UD group gets involved in briefings and conference calls three or four days before the storm is expected to hit.
They use a variety of tools, including the Coastal Flood Monitoring System, as the basis for advising the Delaware Emergency Management Agency (DEMA) about the potential for coastal flooding or inland flooding from streams.
If it appears that a storm is going to have a major impact on Delaware, DEMA’s Technical Assistance Center is activated, and the state’s Emergency Operations Center (EOC) is opened. At least two members of the UD team join the 50 to 100 other people staffing the EOC, including representatives from state agencies, utility companies and the Red Cross.
“I think we provide a pretty important resource for the state by helping answer questions about storm behavior, water levels in streams and coastal areas, and when those levels will peak,” says Delaware State Climatologist Dan Leathers. “We can’t change the weather, but we can help ensure that people are safe during extreme events.”
By beth chajes Delaware Environmental Institute
The inability of the international community to agree or stick to a plan for limiting global climate change leaves local communities in a quandary — what must they do to adapt if at least some level of climate disruption is inevitable?
As Dale Jamieson, director of the environmental studies program at New York University, writes in the 2010 book Climate Ethics: Essential Readings, “the challenge of climate change is not only global and abstract but also local and intimate.”
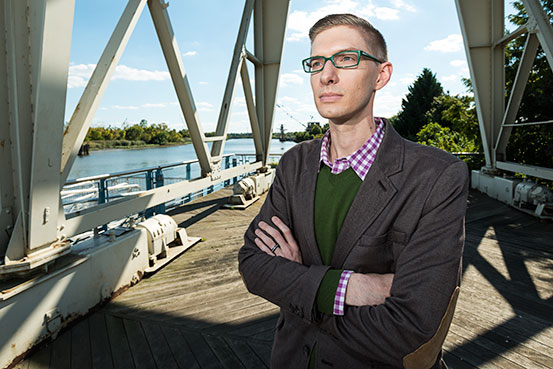
Kevin Adkin, a doctoral candidate in UD’s School of Public Policy and Administration, who is advised by Yda Schreuder of the Department of Geography, believes the time is right for climate science and ethics to coalesce and provide some guidance for those local leaders left to make decisions on behalf of their communities.
In his recent doctoral dissertation, Adkin asserts that while many communities at both the state and local levels are already beginning to adapt to climate change, they often lack a solid ethical framework on which to base their policy decisions.
In practice, formulating such policy often comes down to determining how to spend limited resources: Who should receive financial help or compensation? In many ways, the problem parallels the classic ethical conundrum commonly known as “lifeboat ethics.” If the resources provided by a lifeboat already occupied by 10 people are only capable of supporting 15, who among the 20 people still in the water will be rescued?
Thirty-one of Delaware’s 57 municipalities could be directly impacted by sea level rise by the year 2100.


Flooding in Delaware, one of only three states located on a peninsula, originates along the Piedmont streams of northern New Castle County and from the tidal Delaware Bay and Atlantic Ocean. More than 331 square miles, about 17 percent, of Delaware’s land lies within the 100-year floodplain, an area that includes 18,000 structures and 621 miles of roads.
SOURCES: Delaware Department of Natural Resources and Environmental Control; UD Water Resources Agency
State and local officials in Delaware view sea level rise as the most formidable climate challenge facing the state, which averages just 60 feet above sea level. In a recently released vulnerability assessment report, the Delaware Department of Natural Resources and Environmental Control estimates that between 8 and 11 percent of the state’s land area could be inundated by sea level rise by 2100, and 31 of the state’s 57 municipalities will be directly impacted.
“Although the direct impacts from sea level rise will be felt primarily in areas near tidal waters,” the report states, “every Delawarean is likely to be affected whether through increased costs of maintaining public infrastructure, decreased tax base, loss of recreational opportunities or loss of community character.”
In his research, Adkin focused on the neighborhoods of South Wilmington, Del. Situated on the edge of the Delaware River, South Wilmington is a particularly low-lying area that already experiences frequent street flooding during heavy rains.
Adkin characterizes South Wilmington as a community facing many difficult challenges. With its high percentage of low-income and minority residents, South Wilmington often faces more immediate concerns, such as lack of economic opportunities or crime.
“Industrial brownfields pervade the landscape in South Wilmington,” he says, “but people in the vicinity don’t always make the connection between the brownfields and their economic and health conditions. They have more pressing concerns.”
However, the presence of contaminants, sequestered in the soil of abandoned industrial sites in South Wilmington, could greatly complicate the decisions of community leaders as they struggle to plan for sea level rise.
Scientific studies to analyze what will happen to these contaminants, which range from heavy metals such as arsenic to organic compounds such as PCBs, when they come into contact with sea water are just getting under way at the University of Delaware.
“This is a new area that hasn’t yet been studied,” says Donald L. Sparks, an environmental soil chemist involved in the research and director of the Delaware Environmental Institute at UD. “We know something about the interactions of soil contaminants with freshwater, but the addition of salt from seawater inundation could significantly change the behavior of these toxins.”
If it turns out that sea water mobilizes contaminants and makes them more available for absorption by living organisms, the adverse health impacts on nearby residents could be significant.
Regardless of the outcome of such studies, Adkin says his work will help community, city and state leaders deal with the consequences of sea level rise in South Wilmington and other vulnerable communities in Delaware. He will be submitting his recommendations in reports to the Delaware General Assembly and the Wilmington City Council.
Questions will inevitably arise, he says, as to whether we have more responsibility to disadvantaged populations or to areas with higher property values or where the tax base is greater.
“My aim is not to prescribe solutions,” says Adkin. “Rather I have summarized the ethical principles involved to make climate change policies as equitable as possible. The more equitable our policies are, the less disagreement and animosity we will encounter as a society.”
By beth chajes Delaware Environmental Institute
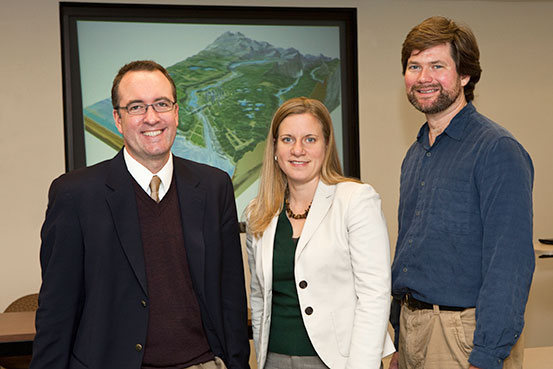
Place a glass of water before UD faculty members Kent Messer, Holly Michael and Joshua Duke and ask them what they know about it, and you’re likely to get three very different answers.
Messer, a behavioral economist, might tell you the price a consumer would be willing to pay for the water given various levels of purity or contamination.
Michael, a hydrogeologist, could describe where the water came from and whether it was pumped from the ground or diverted from a creek in Delaware.
And Duke, an environmental economist, could expound on principles governing the use of a common property resource like groundwater.
Put together all three perspectives, and you’ll come away with a pretty full and compelling story about one of Delaware’s most precious natural resources.
The trio has joined forces on a pair of National Science Foundation grants to provide a more complete account of the water sustainability challenges and options facing Delaware and other areas vulnerable to sea level rise in the coming decades.
“Delaware’s not going to run out of water,” says Duke, “but it might run out of clean water. Whether it’s toxins from a brownfield or salt water from sea level rise—or a combination—that migrates into drinking water, contaminant-free water is going to be harder to come by in the future.”
The statistics are sobering. In Delaware, more than 700 contaminated industrial sites dot the landscape. New Castle County, the northernmost of Delaware’s three counties, where 70 percent of the state’s residents live, has more contaminated sites per square mile than all but three other counties in the United States. A survey by the Department of Natural Resources and Environmental Control counted 159 certified brownfields in the state, including 103 in the city of Wilmington, leftovers of its long industrial history.
Seventy-five percent of the drinking water provided to New Castle County residents comes from surface water, primarily the various tributaries of the Christina River. Below the Chesapeake and Delaware Canal, though, all drinking water—as well as water for irrigation and most industrial uses—comes from groundwater. And while contaminated sites are sparser in southern Delaware, drawing water from wells beneath agricultural lands and coastal plains provides its own set of hazards.
Both research projects undertaken by the team in recent months seek to predict changes in future water resource use in Delaware by integrating the sciences of groundwater hydrology and soil and water chemistry with economics and policy.
In their first project, a three-year, $369,000 NSF grant shared with Jordan Suter of Oberlin College, the team is integrating economic and hydrologic models to take into account feedback loops from human interactions with the environment.
“Groundwater doesn’t just sit in one place,” Michael explains. “It flows through the ground because of various physical forces that we can explain through mathematical models. When humans interact with this system, by pumping groundwater for example, it changes the physics of how the groundwater flows.”
Pumping in one area, she says, may draw water away from another area, causing a neighbor to have to pump water from deeper in the Earth in order to meet his water needs. That’s where Messer and Duke enter the picture with their own models and experiments to measure the economic costs associated with that reaction, to provide insight into human decision-making and to test policy solutions.
As director of the Laboratory for Experimental and Applied Economics at UD, Messer runs experiments with human volunteers who are paid real money to play computer simulation games. Messer alters the conditions, adding a drought here, a contaminated well there, and keeps track of how his subjects respond to changing conditions.
“Because they get to keep the money left at the end of the simulation, my subjects are motivated to make economic decisions that they perceive are in their best interests,” Messer says.
In their second NSF project, the trio is working with Donald Sparks, S. Hallock du Pont Professor of Soil and Environmental Chemistry, to study the effects of anticipated sea level rise on contaminated sites. Their hypothesis is that alterations in hydrology and chemistry of contaminated soils in urban areas, industrial sites and waste disposal sites as the result of sea level rise could enhance the release and mobility of contaminants currently sequestered in the soil, threatening drinking water supplies and food sources.
The study has two major thrusts. The first is to assess the effects of sea level rise on the chemistry and hydrology of contaminated sites. The team will look at sites in Wilmington and in southern Delaware, where the types of contaminants and the hydrology are significantly different. The second thrust is to measure the value people place on changes in risk to their health from contaminated water and on various responses, either technological or behavioral, that could decrease that risk.
Many more visible effects of sea level rise, such as the consequences for coastal infrastructure like roads and bridges, have attracted plenty of attention from researchers. Thus far, however, the interplay of salt water, soil contaminants, hydrology and human behavior has received scant notice. As leaders of a novel approach to a problem just now receiving recognition, the team expects to host a workshop on the theme of water sustainability, contaminants and sea level rise in the spring of 2013.
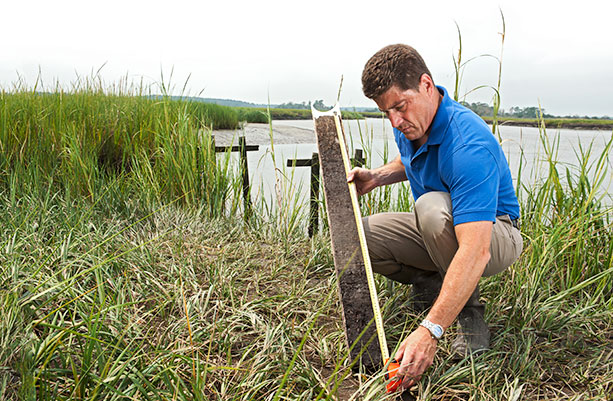
When you live in the flattest U.S. state, in a “geological hotspot” that’s sinking, where the sea has already risen a little over a foot in the past century and is predicted to keep on rising, “it loads the dice when storms occur,” says Gerald Kauffman.
Kauffman, director of the Water Resources Agency, and associate scientist Andrew Homsey, both based at UD’s Institute for Public Administration, recently published a report on the 331 square miles, or 17 percent of Delaware’s land mass, that lies within the 100-year floodplain.
Based on recent FEMA flood insurance studies and other data, they found that more than 18,000 structures exist in this area:
The watersheds with the most structures in the 100-year floodplain include the Christina River in New Castle County (1,007 structures); St. Jones River in Kent County (567 structures); and Indian River Bay in Sussex County (3,856 structures).
Also, approximately 621 road miles lie in this floodplain:
Watersheds with the most road miles in the floodplain include the Christina River in New Castle County (44 miles), the Murderkill in Kent County (16 miles) and Indian River Bay (106 miles) in Sussex.
With sea level rise comes increased flood risk to residents living in these areas. After massive flooding of the Glenville subdivision along Red Clay Creek near Stanton from Tropical Storm Henri in 2003, state and local government bought out the homes, and the community was abandoned.
For public safety in the face of sea level rise, Kauffman, who is a member of the state’s Climate Change Vulnerability Steering Committee, advises strengthening building codes by instituting new permissible standards moving up from the 100- to 500-year floodplain, as well as beefing up the size and height requirements for infrastructure such as roads, dams and bridges.
Kauffman points out that climate change and rising seas already are affecting the ebb and flow of daily life in Delaware, toward a “new normal.”
“School districts are reconfiguring their bus routes for portions of Route 9 that typically flood during a storm,” he says. “People call us about how much warmer their drinking water is in summer, and blue crabs have been as far north as Delaware racetrack.”
Gerald Kauffman, director of the Water Resources Agency at UD, prepares to measure the height of the water surface in White Clay Creek near Newark, Del. »
By teresa messmore College of Earth, Ocean, and Environment
When a storm hits, Delaware’s coastal communities know which areas are likely to flood. But what will happen in coming decades when predicted sea levels are higher? How will the flood zones expand? Can stormwater systems handle increased demands? Will homes and businesses be safe?
The Delaware Sea Grant College Program is helping residents and municipalities prepare beyond existing hazard mitigation efforts, which are typically based on current and historic risks.
“It’s important for communities to plan with a longer-term view of hazards that includes future impacts associated with climate change,” says Wendy Carey, coastal processes specialist. “We encourage people to plan for future flood risk, whether it’s because of the next big storm or sea level rise.”
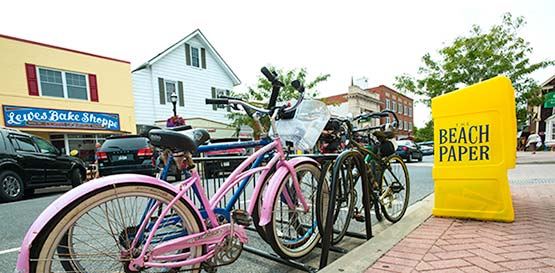
Delaware Sea Grant partnered with the city of Lewes to expand upon plans designed to minimize damage from hurricanes, nor’easters and tropical storms. They assessed vulnerabilities related to natural hazards and climate change, such as temperature increases, rising sea levels and more intense storms. Workshops were convened to receive input from the public, prioritize issues of concern and develop action strategies. The City of Lewes Hazard Mitigation and Climate Adaptation Action Plan was unanimously adopted by the Lewes City Council in 2011, one of the first such documents in the country.
Lewes’ Mitigation Planning Team is working to implement identified strategies as funds and staff time allow, starting with public education on hazards, emergency preparedness, groundwater safety and flood and wind insurance. Since FEMA flood zones are based on historic risk without sea level rise factored in, Carey shares information on best practices, such as why property owners should consider building beyond minimum elevation requirements. Raising first floor elevations by 12 to 18 inches, for example, provides better protection from flood damage and may reduce insurance premiums.
In Delaware City, Sea Grant is working with the local community to address natural hazards and climate change in relation to infrastructural upgrades, land-use plans and building standards, ecosystem protection, and disaster prevention and preparedness. Stormwater system improvement is a priority, with flooding from the Delaware River potentially exacerbating drainage problems as sea level rises and storms become more severe.
“This is a small community with issues that a lot of larger cities located at the coast are also faced with,” Carey says, adding that floods have historically impacted Delaware City’s business district and residential areas.
A community task force, including elected officials, business leaders and representatives of local historic preservation and planning commissions, will use interactive whiteboard technology and geographic information system (GIS) maps to pinpoint trouble areas as a group. Collaborating with the Partnership for the Delaware Estuary and The Resiliency Place, Delaware Sea Grant is working with Delaware City to enhance the hazard mitigation planning process and create an action plan that can accommodate future changing conditions.
The New Jersey Sea Grant Consortium and Pennsylvania Sea Grant also will work with the project partners to extend climate adaptation outreach efforts to local governments regionally, sharing lessons learned from the process and explaining why it’s smart to build beyond current code requirements.
“What we’re hoping to do is develop a toolkit that will make it easy for other communities to take the same steps and develop the same materials to work themselves through the process,” Carey says.
By karen roberts College of Engineering
Small changes in temperature (0.2°C per decade) and widespread snow melt are leading to extreme changes in sea level rise across the world. In the U.S. Mid-Atlantic region, climate change means increased hot days and heat waves, rising sea levels and increased frequency of intense precipitation events.
For transportation planners, this is particularly concerning in coastal regions where roadway flooding often follows volatile precipitation events. In other areas, storm surge combined with climate change can impact low-lying roads and rail lines. Because changes occur gradually over time, there is seldom an urgency to act.
Sue McNeil, director of UD’s University Transportation Center (UD-UTC), has spent the last five years contemplating how Delaware, and the nation, can best adapt transportation planning measures to overcome risks associated with sea level rise and climate change.
The UD-UTC is a Tier II University Transportation Center organized within the Delaware Center for Transportation (DCT). The UD center serves as a resource to the state and nation for data and tools to understand and improve our transportation corridors’ resiliency to short- and long-term pressures like climate change. Center research ranges from advanced pavement designs and materials that can adapt to temperature and saturation changes, to cost-effective ways to salvage roads or make them less vulnerable.
A UD professor with more than 25 years’ experience in infrastructure management, McNeil became interested in the issue in 2008, when she developed a white paper for the Transportation Research Board (an arm of the National Academy of Sciences) detailing research needs for climate change adaption as it relates to transportation.
She reviewed work from around the globe, including the United Kingdom, Australia and New Zealand, where transportation agencies recognize research linking climate change, asset management and sustainability. She subsequently participated in national studies on the effect to highway systems and transportation infrastructure and conducted local research on specific impacts to the I-95 corridor in Maryland and Delaware.
“Each time I drive I-495 along the Delaware River, I think about what impact adding half a meter of sea level rise and a large storm could have on our roads,” she says.
According to McNeil, transportation planning that integrates climate change is necessary to avoid compounding problems in the future. In practice, roads and bridges are designed with a lifespan of 25 years, but states often try to eke out 30, 40 or 50 years, making strategic upgrades that add strength to the road structure, as advanced materials and techniques come to market.
Planning ahead is particularly important along the I-95 corridor because all modes of transportation are at risk—from major thoroughfares to rail lines—especially along minor coastal roads near the Delaware Bay. Important transportation planning considerations should include road adaptation, reducing vulnerability and mitigating recurrent problems.
“We must always ask what happens under climate change because it is sea level rise on top of heavy storms that becomes the real problem in the short term and causes recurrent long-term problems,” she says.
According to McNeil, Delaware is ahead of its peers when it comes to sea level rise. While the UD-UTC winds down, the DCT is gearing up, working with regional planning groups such as the Wilmington Area Planning Council and the Delaware Department of Transportation, which mirror the UD-UTC’s efforts on a larger scale.
McNeil also would like to create a database to record how many events occur in Delaware annually, taking into account how frequently roads are rebuilt and taking advantage of prediction modeling techniques to estimate future effects. Future projects, she says, could include decision models and policies for vulnerable roads and highways that are regularly inundated by weather.
In essence, she would like to create a road map—one that will help lead Delaware toward a sustainable transportation future.
By adam thomas
College of Agriculture
and Natural Resources
For Delaware farms near the coast or close to brackish waters, dry seasons can hit hard in two ways. Not only are the farms deprived of fresh rainwater to help boost their crop yields, they also face the threat of farmland salinization.
Farmland salinization is exactly as it sounds: salt water seeps into farmland soils and spoils crops, and with sea levels rising in the First State, the problem doesn’t appear to be going away any time soon.
“There’s probably acres that get flooded every year, so that’s a continual challenge,” says Cory Whaley, a Cooperative Extension agent at UD. “The salt levels just get so high that it becomes, in most cases, impossible to grow our normal grain crops, corn and soybeans.”
That’s a big problem for Delaware farmers, as the two most popular crops grown in the state—corn and soybeans—are sensitive to salt, although
Whaley does note that corn is slightly more salt tolerant than soybeans.
In 2008, Whaley saw the effects of farmland salinization firsthand in
areas around the Delaware Bay. A high tidal surge impacted thousands of acres, resulting in significant crop loss.
Not only did the tidal surge kill the crops for that season, but it also had lingering effects for future yields.
“The frustrating part is that it destroyed the crop that was there, but if you come back and replant, your chances of having salt injury on the replant is there, so it’s almost like you’re leaving it barren,” Whaley says, noting that this problem is largely dependent upon how long the salt water sat on the cropland and how much salt got absorbed into the soil.
When it comes to dry seasons, Whaley says the threat of farmland salinization is especially prevalent because “you’re relying on rainfall or irrigation to leach out the excess salts. So the more precipitation on the ground, the more salt you’re going to leach out.”
When there is big tidal flooding, like Whaley encountered in 2008, he says an option farmers have to deal with farmland salinization is to moldboard plow. This practice allows for a plow to go 10–12 inches into the earth and turn the soil over, taking the topsoil and putting it on the bottom. This helps the crop get going by having fresh soil on top and allowing the rain to leach out the salt from the bottom of the crop.
Whaley said that another thing they noticed was that when they did soil testing for salt concentrations, they found that as the salt water receded, the salt levels were higher the closer they got to where the water initially came up.
For farmers that grow in areas where salt levels are the highest, Whaley recommends growing crops that can handle higher salt levels such as wheat, barley or certain species of grass for hay.
By Tracey Bryant Office of Communications and Marketing
Salt. It’s toxic to most plants. So as sea water washes onto farmland during coastal storms or turns irrigation water brackish, how will farmers fare? Traditional crops like corn and soybeans have little tolerance for salt water; they simply wither and die.
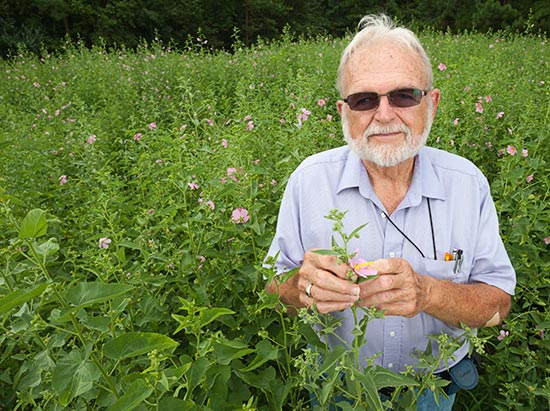
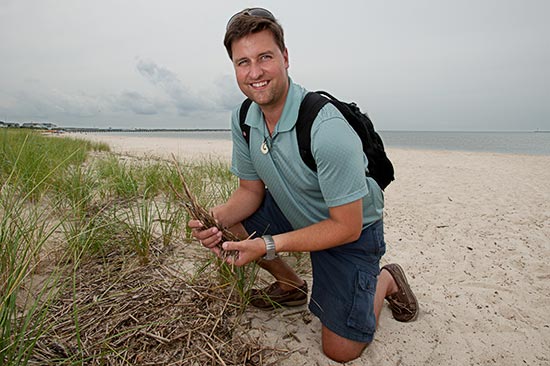
Jack Gallagher and Denise Seliskar, marine botanists in UD’s College of Earth, Ocean, and Environment, are experts on halophytes, plants that grow in wet, salty conditions. In the Halophyte Solutions Laboratory at the Hugh R. Sharp Campus in Lewes, and in nearby test plots outside, the researchers are working to develop seashore mallow, a native marsh plant known scientifically as Kosteletzkya pentacarpos, into a new salt-tolerant crop.
When it blooms in August and September, seashore mallow is easy to spot in Mid-Atlantic marshes — just look for the two-inch, pink, hibiscus-like flowers.
Yet seashore mallow is not only attractive, it also provides valuable products and services, the UD researchers have discovered, from biofuel and animal food to a vegetative buffer for land that otherwise would be left barren and eventually attract invasive plants.
“Seashore mallow produces seeds that are 18 percent oil by weight — oil that can be used to make biodiesel fuel,” Gallagher says. “Once the oil is extracted from the seeds, about 32 percent of what is left is protein that can be used in animal feed.”
The “straw” or stem of seashore mallow can be used as a feedstock for producing fiber products, such as oil-absorbent pellets, small mammal bedding, a hydroseeding medium for planting grass on road banks and even an organic kitty litter.
Seashore mallow offers a variety of other pluses to farmers facing the challenge of keeping bayside farmland productive in the face of sea level rise. As a perennial, seashore mallow is more sustainable than traditional oil seed crops because it does not need to be planted every year. And the plant’s substantial root system serves as a “carbon sink” in the soil, meaning it offsets the additions the oil releases into the atmosphere when used for fuel.
Gallagher points out other advantages: as a marsh plant, seashore mallow is naturally flood-tolerant, and its deep root system makes it drought tolerant. Also, traditional farm machinery can be used to plant and harvest it.
According to Gallagher, seashore mallow can be a big aid to coastal farms.
“Planting seashore mallow will enable farmland to remain agriculturally and economically viable for a longer period than if no such halophytic crop is planted while maintaining a nutrient-absorbing buffer between farmland and the marsh fringing the bay,” he says.
The UD team recently undertook a major reconnaissance mission along the Atlantic and Gulf coasts to find and collect seashore mallow for a selection and breeding program. Although easy to spot when in bloom, the plant is difficult to identify at other times because it’s not a dominant plant in most marshes.
To increase their chances of finding the plant, the researchers visited numerous herbaria, some with specimens reaching back to the 1800s, to learn where their seashore mallow had been collected. Then a volunteer, Dave Lewis, used Google Earth to locate the sites on a map. When the scientists got to the locations and actually found plants, they used GPS to pinpoint the specific collection sites.
They collected both whole plants and seeds, storing them in a plastic box cooled with ice, until they returned to the Lewes campus. There, biologist Donna Hamilton continues to care for the plants in the greenhouse. Offspring of these plants are now growing in field plots irrigated with fresh and salt water.
Even though Gallagher officially retired last year, the professor emeritus comes into the laboratory every day just as he always has, eager to continue the research. The team is now studying the seashore mallow specimens and making crosses among them to develop a superior plant line with all the characteristics desired for a salt-tolerant biofuel, feed and fiber crop.
Gallagher says, “I view seashore mallow as the ‘pig of the plant world’, having everything but the squeal useful.”
There’s often a correlation between the number of flower petals and the number of seeds a plant yields. Although Linnaeus gave seashore mallow its species name (pentacarpos) for five, the UD team has found specimens with six petals, which generally yield six seeds. This trait is actively being selected in UD plant breeding programs.


The bright pink, two-inch flowers of seashore mallow (Kosteletzkya pentacarpos) resemble those of a hibiscus. The blooms are a favorite of bees and hummingbirds.
By teresa messmore College of Earth, Ocean, and Environment

At left is a soil core collected from a salt marsh in Barnegat Bay, New Jersey, in 2009. The soil changes from living roots at the core top to peat and mud at the bottom. The accretion rate, based on radionuclide age dating, is 2.5 millimeters per year.
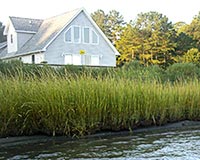
Marshes reduce storm flooding, filter contaminants out of water and provide habitat for birds, fish and other wildlife. However, these environmentally critical areas have decreased in extent along the coast in recent decades, and UD researchers are working to better understand the factors that affect marsh stability—especially in the face of sea level rise.
“The amount of space that’s available for marshes to survive is getting smaller and smaller,” says Christopher Sommerfield, associate professor of oceanography in the College of Earth, Ocean, and Environment (CEOE).
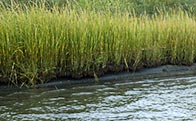
Tidal marshes exist in low-lying coastal areas between the low and high tide lines. On the landward edge, marshes often abut farms and developed properties. On the ocean side, they face increasingly higher sea levels—creating a “coastal squeeze” for space.
Too much water can drown out the tall grasses and other vegetation characteristic of marshes, potentially turning them into embayments and accelerating inundation.
Sommerfield is researching the critical role of sediment flow in tidal marsh health. Marshes grow vertically as muddy sediment is carried in from rivers and other sources, raising the landscape by a combination of sedimentation and plant growth. The process, called accretion, keeps marshes at or above sea level when undisturbed.
“The elevation of a marsh landscape relative to mean sea level is controlled by a balance between upward accretion at the surface and downward sinking of deeper strata,” Sommerfield explains.
Sommerfield is measuring accretion rates at coastal and estuarine marsh sites in the Mid-Atlantic region using radionuclides, or variants of elements emitting radiation, as a chronological tool.
Naturally occurring and manmade radionuclides enter estuaries through precipitation and other sources, attaching to particles mixed in the water and eventually getting buried in sediment layers. Sommerfield measures the concentration of radionuclides in marsh soil cores, and knowing the half-life of decay, converts soil depth to age. The age dates are used to calculate accretion rates, which are cross-referenced with historical tide-level data for the past 100 years.
“The radionuclide chronometers allow us to average the rate of accretion over the same time frame as tide gauge recordings and determine whether marsh growth is keeping pace with recent sea level rise,” he says.
Thomas McKenna, associate professor at the Delaware Geological Survey, and Jack Puleo, associate professor of civil and environmental engineering, also are examining marsh dynamics, but on a daily as opposed to decadal time scale. Their focus is the day-to-day flow of water and sediments in tidal marshlands.
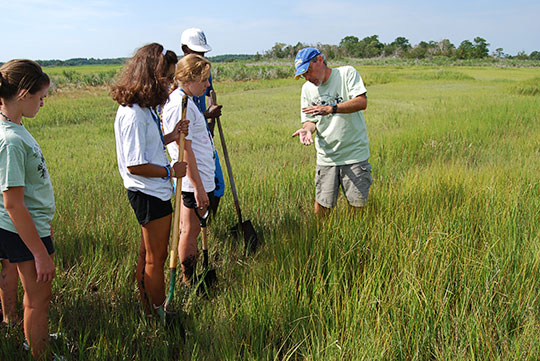
Using high-resolution cameras and thermal infrared technology, the researchers are capturing images of tidal flow during the night and daytime at a marsh near Bowers Beach, Del., where relative sea level is increasing at a rate faster than anywhere else on the Atlantic coast.
The compiled image sequences will show how tides move through time and illustrate the physics of how the water moves in and out of the marsh, McKenna says. The image data will be compared with measurements of water velocity, sediment concentration and water depth at the site, and then the researchers will develop an algorithm to extract information that can be used by modelers to predict rising sea levels in marshes.
Physical oceanographer Young-Heon Jo also uses technology to gauge marsh changes, instead utilizing early aerial photos and satellite-derived images of marshes along the Inland Bays. So far, he has compared satellite images from 1992 and 2007 to determine gains and losses of tidal marsh vegetation.
Next, he will use historical aerial images to estimate how much salt marshes changed over the last 70 years due to sea level rise, factoring in changes caused by human development.
“These researchers are using various techniques to tackle scientific questions related to sea level rise,” said Nancy Targett, dean of CEOE and Delaware Sea Grant director. “Their work can help regional natural resource managers monitor our valuable marshes and predict future changes.”
Christopher Sommerfield examines a core sample, a vertical record of marsh growth.
How old are the soils? See the image at upper-left.

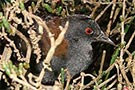
The Spartina high salt marsh, a habitat of conservation concern in Delaware, harbors the black rail, one of the rarest bird species along the Atlantic coast. Black rail populations have declined by as much as 85 percent over the last 20 years. More than 99 percent of its habitat is predicted to be lost under one Delaware sea level rise scenario of 0.5 m (1.6 ft) by the year 2100.
The parks and wildlife areas that many enjoy in Delaware would lose out to sea level rise. By the end of this century, under one of the state’s planning scenarios of 1.5 m (4.9 ft), the nature preserve on Pea Patch Island would be totally inundated, as would up to 94% of the more than 16,000 acres of Bombay Hook National Wildlife Refuge and up to 98% of Prime Hook National Wildlife Refuge.

Source: Delaware Department of Natural Resources and Environmental Control
Sea level rise is the most significant issue facing coastal ecosystems and communities over the coming decades, threatening even those that can fly. Luckily for the tidal marsh birds that call the Mid-Atlantic and New England marshes and wetlands home, they have University of Delaware professor Greg Shriver and a team of researchers looking out for them.
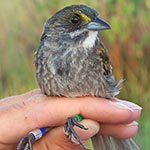
Closeup of a
saltmarsh sparrow. »
As part of the Saltmarsh Habitat and Avian Research Program (SHARP), Shriver and his colleagues are researching tidal marsh birds from Virginia to Maine to identify and conserve areas in the region that are important to their long-term survival, and to provide a consistent platform for monitoring the health of North America’s tidal marsh bird community. The team includes researchers and students from UD, the University of Connecticut, the University of Maine and Maryland/D.C. Audubon.
“It’s a big information need for the northeast coast of North America,” says Shriver. “You’re not going to go anywhere on the planet and find more tidal marshes than you do between Georgia and Maine. This is where it happens.”
The study is looking at providing detailed conservation recommendations for six species: American black duck, Nelson’s sparrow, clapper rail, willet, saltmarsh sparrow and seaside sparrow, with a heavy focus on the latter four.
“If the marsh is gone, then these four species are gone,” Shriver warns.
The saltmarsh sparrow is of particular importance because it is endemic to the Mid-Atlantic and New England salt marshes. “The entire global population of saltmarsh sparrow is in this region. This is it,” says Shriver.
Shriver’s UD group, which includes doctoral students Whitney Wiest and Rebecca Kern, has two main research components. The first is to conduct a survey of the marshes from Virginia to New Jersey in order to estimate and predict where the marshes in certain areas are likely to move next and then help to facilitate that movement. The group is using Real Time Kinetic (RTK) GPS instruments that can give readings at sub-centimeter accuracy for the elevation of a certain location. They are then using these data to verify models of sea level rise obtained from the National Oceanic and Atmospheric Administration (NOAA).
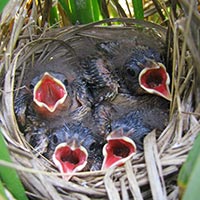
The second component is a demographic study of the birds at a site in southern New Jersey. The birds are caught in a mist net, which is about seven-feet high and practically invisible. The birds fly into the net, and the researchers tag them. They also locate and monitor nests and estimate the annual reproductive productivity for each location. These data, combined with similar demographic surveys in sites in Connecticut and Maine, will be used to model the population viability for tidal marsh birds in the face of marsh loss caused by sea level rise.
Shriver has been studying tidal marsh birds since he initiated his dissertation work on the subject in New England in 1998. A major component of the present research project is to revisit some of the same locations he surveyed in the late 1990s to compare the populations of tidal marsh birds over time.
“So we’ll have two estimates of the number of birds at each place,” says Shriver. “And that will be the first time that anybody has attempted to show change over time for these species.”
With sea levels having risen around two millimeters per year for the past century, and with the threat of sea level rise accelerating in the future, leading to altered marsh vegetation and greater marsh loss, Shriver says it is imperative to have measures in place to help protect these birds and their habitat.
“The problem with sea level rise is you’re not going to stop it,” Shriver says, adding that the best we can do in the face of sea level rise is to “identify where the marsh is going to be and then stop anything that would impede it or help to actually facilitate marsh transgression.”
SHARP has been funded by a diversity of state wildlife agencies through regional State Wildlife Grants and the U.S. Fish and Wildlife Service within the U.S. Department of Interior. The majority of initial funding was provided by a Competitive State Wildlife Grant administered by the U.S. Fish and Wildlife Service.
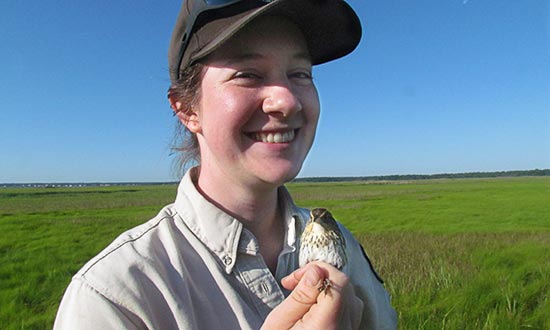 UD doctoral student Becky Kern holds a saltmarsh sparrow for tagging.
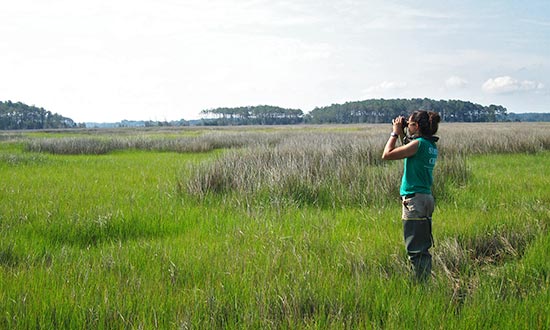 Doctoral student Whitney Wiest scans the marsh for clapper rails.
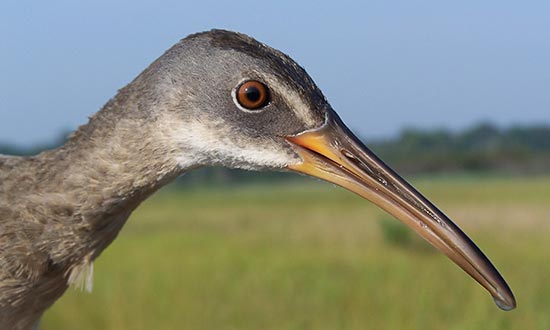 The clapper rail has a clattering call. A group of these birds is known as an “applause” or “audience.”
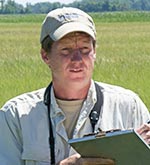
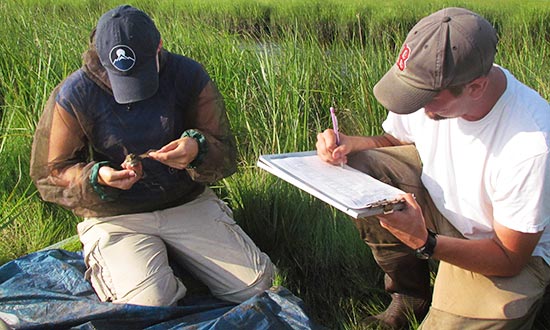 Field crew members at Edwin B. Forsythe National Wildlife Refuge in New Jersey record data on a sparrow.
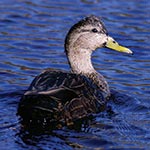
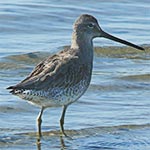
The study is looking at six species: American black duck, Nelson’s sparrow, clapper rail, willet, saltmarsh sparrow and seaside sparrow.
By teresa messmore College of Earth, Ocean, and Environment
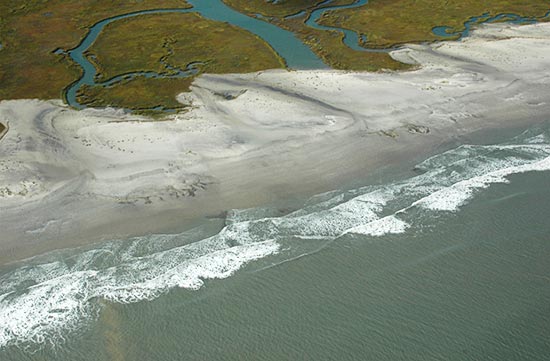
Along much of the East Coast, long stretches of thin, sandy islands provide a buffer from surging waters during storms and help protect the mainland. UD researchers are studying how these barrier islands are changing to better predict coastal response to sea level rise.
“Barrier islands are the canaries in the coal mines, so to speak, in terms of sea level impacts,” says Arthur Trembanis, associate professor of geological sciences and oceanography. “They are dynamic and finely tuned systems that can be readily—and often dramatically—perturbed by impacts from storms and sea level rise.”
Barrier islands form when waves and wind push sand into mounds that gradually enlarge into dunes and then islands, with tides and currents bringing in water at certain spots to create inlets. Changes to any part of this delicately balanced system can re-form an island’s shape and location, as well as the surrounding bays and lagoons. In fact, East Coast barrier islands were once much farther out to sea near the edge of the continental shelf and have moved landward as water levels crept higher.
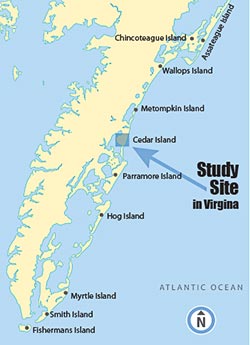
Delmarva’s barrier island system begins at Cape Henlopen and extends all the way down through Assateague Island to the mouth of Chesapeake Bay. Trembanis and graduate student Stephanie Nebel are examining uninhabited Cedar Island in Virginia, about 90 miles south of Fenwick Island, Del., as a natural laboratory.
They’ve found that the shoreline there has been retreating toward the mainland at increasingly rapid rates. Shoreline retreat was three times faster from 1994–2007 than 1852–2007, changing from 4.1 to 12.6 meters (13.4 to 41.3 feet) per year.
Trembanis said the trend may point to Delmarva barrier islands showing early signs of a shift to “runaway transgression,” where the islands become smaller and thinner while the inlets and back-bay areas become bigger.
Rising sea levels contribute to this island shrinking, but storms are also a factor. Barrier islands are frequently exposed to hurricanes and tropical storms, when widespread washover can alter the shoreline position drastically. In September 2006, for example, Tropical Storm Ernesto diminished shorelines on Cedar Island by as much as 55 meters (180 feet).
“There is an important feedback loop between sea level rise, storminess and the response of the barrier islands,” Trembanis says.
The frequency of intense storms has increased since 1980, which the scientists found to be directly related to the rate of erosion at Cedar Island. With the Virginia barrier islands eroding faster than the rest of the Mid-Atlantic as a comparative hotspot, next they are investigating the role of offshore sand deposits—or lack thereof—in erosion rates.
“We’re curious to see if patterns of hotspots are being influenced by the conditions offshore,” Trembanis says.
Tim Targett, professor of marine biosciences, is Delaware’s lead investigator on a regional project to evaluate how altered shorelines affect life in the coastal bays of Delaware, Maryland and Virginia.
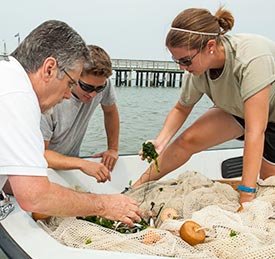
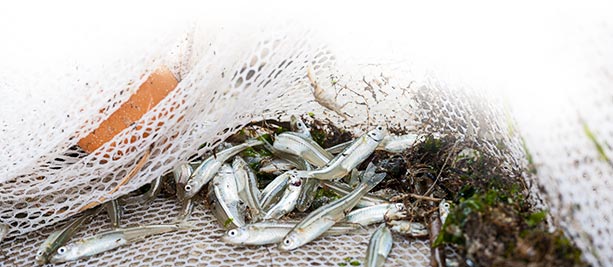
From left, Tim Targett, Mike Torre and Rachel Dixon examine the catch, which includes Atlantic silversides, blue crabs, a puffer and mummichogs.
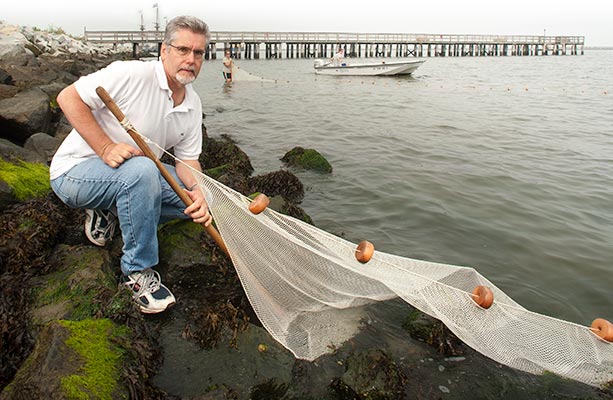
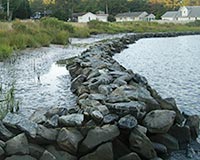
As sea level rises, why can’t we just build sea walls and armor the coast with riprap? A regional scientific reconnaissance mission is revealing what some of the ecological costs of such choices could mean.
Waves splash around Tim Targett’s knees, as he anchors his end of the seine along a section of shoreline covered in piles of rocks—riprap—near Lewes, Del. Graduate student Rachel Dixon wades toward him holding taut her end of the 6-foot-high, 50-foot-long net. They then carefully move the ends of the net together, forming a fish corral.
When they haul in and open the net, handfuls of fish flip about, some with sides glinting in the sun like a metallic racing stripe. They are Atlantic silversides—small fish that typically swim in schools as a survival strategy because, to larger fish, they represent supper.
“The Atlantic silverside is one of our most important forage fish, providing food for striped bass, Atlantic mackerel, bluefish and other species,” notes Targett, a professor of marine biosciences in UD’s College of Earth, Ocean, and Environment.
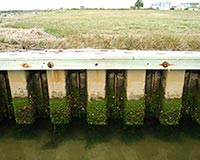
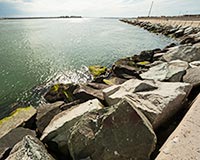
Targett is examining the abundance and diversity of fish using different shoreline types, including shores “hardened” with bulkheads and riprap, whether installed to help morph farmland into a bayside development or to fend off a rising sea. Scientists estimate that up to 80 percent of the shoreline in some Chesapeake Bay tributaries have been altered with such structures.
Targett leads the Delaware portion of a scientific reconnaissance mission launched by the National Oceanic and Atmospheric Administration (NOAA) three years ago to evaluate how altered shorelines affect life in the coastal bays of Delaware, Maryland and Virginia. Finfish, shellfish and sea birds, marsh grasses and submerged aquatic vegetation are all a focus of the study, which encompasses estuaries large and small, from the Chesapeake and Delaware bays to Delaware’s Indian River Bay.
The $4-million, five-year project, supported by NOAA’s Center for Sponsored Coastal Ocean Research and headquartered at the Smithsonian Environmental Research Center near Edgewater, Md., involves more than 15 collaborating scientists from universities and institutes across the region, as well as state resource managers.
Working together, they want to determine the amount of natural shoreline needed to sustain living resources and develop models that can predict the cumulative impacts of multiple stressors on habitat quality, including shoreline hardening, land use changes and the expansion of Phragmites, an invasive reed.
According to NOAA, such a predictive capability would help transform resource management from the current “parcel by parcel” approach to one in which regional ecosystem impacts factor significantly into the decision-making process.
As sea level rises, so does increased pressure to protect the coast with bulkheads, which are retaining walls typically made of wood, metal or concrete; or with riprap. “Riprap-sills”—stone banks with marsh grasses planted immediately behind them—also act as shoreline stabilizers.
Although older bulkheads exist in Delaware, it’s important to note that no new bulkheads are being permitted in the state, and state agencies are recommending that landowners install riprap-sills.
In Delaware’s coastal bays, Targett and his graduate students are assessing the ecological impact of such altered shorelines by evaluating where fish prefer to live, as measured by their abundance and diversity at six shoreline types: bulkhead, riprap, riprap-sill, sandy beach, invasive Phragmites (common reed) and native Spartina (smooth cordgrass).
“We’ve approached this question of preferred fish habitat in a very spatially and temporally replicated way,” Targett says. “We were able to sample very intensively at these six shoreline types and catch thousands of fish. All were kept alive, counted, measured and released.”
During sampling operations from early June through late September 2010 at 20 sites in the shore zone along Indian River Bay and two of its tributaries—Indian River and Pepper Creek—Targett and his team caught and identified 102,343 fish.
Although 28 species of fish were recorded, five species accounted for about 95 percent of the total catch: the mummichog, Atlantic silverside, Atlantic menhaden, striped mullet and striped killifish.
The Spartina shoreline had the greatest density of fish, followed by the beach shoreline. Riprap and bulkhead areas had the least fish density, and no species preferred Phragmites over the other shorelines.
Additionally, the team examined dissolved oxygen (DO) fluctuations among the shoreline types, recording data over 24-hour cycles during a two-month period. They found that DO levels commonly went below the 4.8 mg/l threshold established by the Environmental Protection Agency as necessary for growth and the 2.3 mg/l threshold for survival — not good for fish. They also found differences among the shoreline types, with Spartina shorelines having the greatest DO levels, and bulkhead shorelines the lowest.
Another facet of the study, focusing on the preferred spawning habitat of Atlantic silversides, was reported by Richard Balouskus and Targett in Estuaries and Coasts in March 2012. Balouskus, one of Targett’s advisees, received his master’s degree in May 2012 and is now a biologist at ASA, a global science and technology solutions company.
Where do fish want to live? UD researchers found, by far, the highest abundance of fish along the Spartina marsh, followed by the beach, among such key forage species as mummichogs, menhaden, Atlantic silversides, striped mullet and striped killifish.
During 50 sampling days in spring 2010, the scientists collected over 3 million Atlantic silverside eggs. Although the fish’s whitish-yellow eggs were deposited at all six shoreline types, more than 93 percent were found on Spartina shorelines, and most of the eggs (91 percent) were collected from the filaments of Enteromorpha, a species of green algae.
“The Mid-Atlantic region has seen a decrease in Spartina in estuaries during the past few decades, while invasive Phragmites and several types of shoreline hardening have become more common, and that’s of concern,” Targett notes. “Our research shows that ‘living shorelines,’ especially those containing Spartina, are very important to fish.”
Targett says the next phase of the study, which will continue in spring and summer 2013, focuses on Delaware Bay and the ecological impacts of riprap, the primary hard structure used along the bay to stabilize the shoreline. He and graduate student Michael Torre are comparing abundances of predatory species such as weakfish, striped bass and bluefish along riprap and beach areas near the Lewes-Cape May Ferry Terminal, Mispillion Inlet and Port Mahon on the bay’s southwest shore.
“Our research shows that ‘living shorelines,’ especially those containing Spartina, are very important to fish.”
— Tim Targett
More than 93 percent of the Atlantic silverside eggs collected by the UD team were deposited along shorelines bordered by the marsh grass Spartina.
By karen b. roberts College of Engineering

Walrus use sea ice as a reproductive, migration and resting habitat. However, as sea ice melts and recedes, this marine mammal increasingly is threatened.
A University of Delaware research team, led by Chandra Kambhamettu, professor of computer and information sciences, has developed a novel camera system to map the surface topography of Arctic sea ice. The effort is part of a collaborative National Science Foundation project involving scientists at UD, the University of Virginia and the University of Alaska, Fairbanks, to assess walrus habitat.
Scott Sorensen, a doctoral student at UD, returned from a two-month expedition aboard the German research vessel Polarstern in October. He installed three cameras aboard Polarstern to continuously capture images of the sea ice during the expedition. He and fellow doctoral student Rohith Kumar designed the camera system in UD’s Video/Imaging Modeling and Synthesis Laboratory (VIMS). The team is now using the raw data to reconstruct polar ice floes in 3-D.
Walrus gather in large herds of up to 10,000 animals in the heavy ice of the central Bering Sea in winter and migrate to the Chukchi Sea of Russia and Alaska in spring. During the summer, the sea ice melts and recedes into the Arctic Basin.
Sorensen explains that walrus move slowly on land, and if the ice floes are too large, they are at risk for predators such as polar bears. Too small and the ice will not support the walrus’ weight.
“Without good metric data about ice floes and sea ice thickness, among other things, we can’t really classify habitat,” Sorensen says.
Ice, however, is very hard to reconstruct in 3-D because it is white and has no visual texture. Researchers typically rely on correspondences between pictures to recreate an image in 3-D, but determining what pixels correspond between two white images is nearly impossible.
“There is good data from satellites that use infrared backscatter, but it’s really coarse data with a pixel resolution of three meters,” Sorensen notes.

“Acquiring satellite data synchronized with other ship-based measurements is quite challenging,” Kambhamettu says. “A ship-based camera system is a good way of acquiring visual data on a research cruise.”
Kumar’s algorithm, however, uses areas of higher competence to interpolate areas of lower confidence, allowing for greater surface reconstruction that results in dense 3-D reconstructions. The UD system offers precision accuracy within 10–20 centimeters and, because it only takes fractions of a second to expose the camera to the desired area or object, the data can be recorded in real time.
Two of the cameras aboard the ship worked in a stereo pair—like eyes. While humans combine eyesight and cognition to visually estimate the depth of different objects, cameras rely on parallax (relative shift), calibration (camera reconfiguration) and triangulation.
All objects that came into the camera’s view were recorded, creating a fundamental data set about the sea-ice surface topography in 3-D. The research team is now recreating the images in 3-D and stitching them together to create one long record of the landscape.
“This type of information has never been recorded before,” says Kambhamettu.
A third camera for recording structure from motion analysis was positioned between the stereo cameras to independently attempt to capture the same information using only one camera. The research team plans to compare the results from both systems to determine which provides the best data.
According to Kambhamettu, the work could lead to a database to house habitat and other information for use by other scientists and engineers, as well as new public education information about the polar regions and the plight faced by wildlife endangered due to human infiltration in the region; the polar bear, for example. Additionally, the work may shed light on environmental hazards related to opening transoceanic shipping lines, where sea ice has melted, for transporting oil and other commodities.
“This data will be longitudinal in nature—enabling time-space data that will change with each cruise, building a useful reference for community researchers of how the topography and animal habitats are changing over time,” Kambhamettu says.
The UD system’s baseline infrastructure is versatile and can cover various distances with equal accuracy, an advantage that may also allow the technology to become competitive with LiDAR (Light Detection and Ranging) systems.
“Our system costs approximately $10,000 to $12,000 to deploy for a single use, which represents one-tenth the cost of the LiDAR system,” he adds. Deployed at close range, the system can record 3-D images of tabletop objects and artifacts, too.
Kambhamettu is already in talks with UD’s Office of Economic Innovation and Partnerships (OEIP) to patent the technology and protect his team’s research. Ultimately, he hopes to make available some open-source executable files for those in the research community conducting similar studies. He is also investigating licensing the system and its algorithms for industry use.