Benchmark Problem #4: Two-dimensional submarine granular slide
This benchmark problem is based on 2D laboratory experiments of Kimmoun and Dupont (2015; see Grilli et al., 2016 ) in Ecole Centrale de Marseille's (IRPHE) precision tank (Marseille, France), for a series of triangular submarine cavities filled with glass beads, released by lifting a sluice gate and moving down a plane slope into water. See Figures 4.1 and 4.2 for pictures and sketches of the experimental set-up.
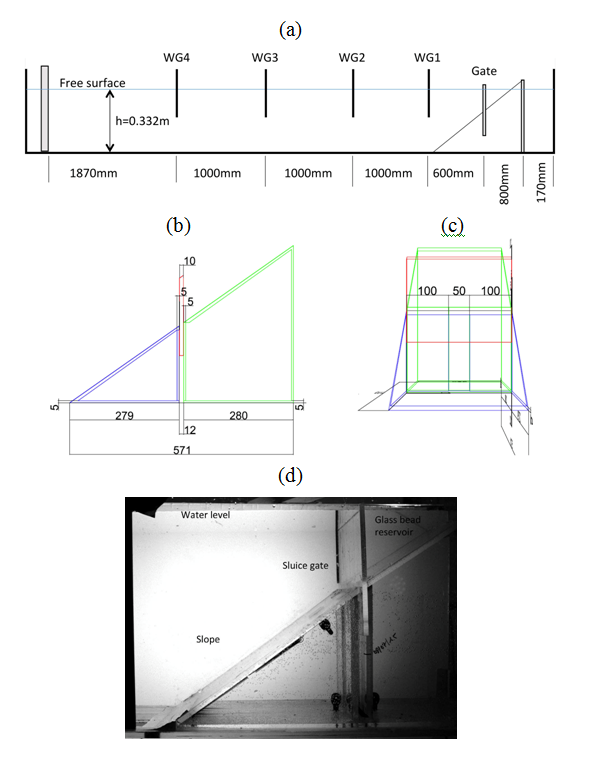
Fig. 4.1: Set-up for laboratory experiments of tsunami generation by underwater slides made of glass beads performed in IRPHE's precision tank of (useful) length l = 6.27 m, width w = 0.25 m, and water depth h = 0.330 m. Upon release, beads are moving down a θ = 35 deg. slope. (a) Longitudinal cross section with marked location of sluice gate and 4 wave gages (WG1, WG2, WG3, WG4). (b,c) Zoom-in on side- and cross-section views of slope and sluice gate (dimensions marked in mm). (d) Picture of experimental set-up around slope and sluice gate.

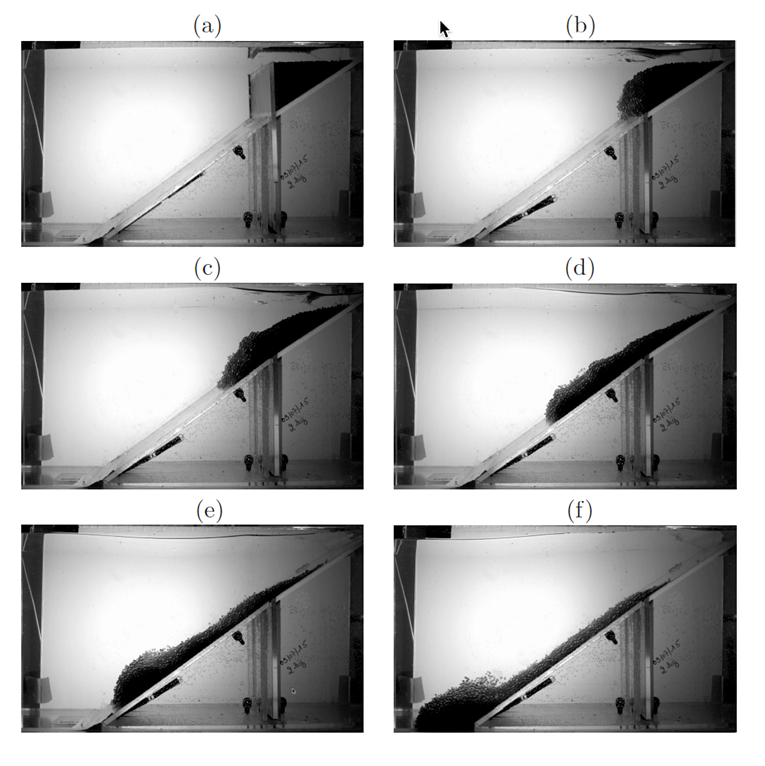
Fig. 4.2: Snapshots of laboratory experiments of tsunami generation by underwater slide made of glass beads, for h = 0.330 m; db = 4 mm, Wb = 2 kg, at times t = (a) -0.105; (b) 0.02; (c) 0.17; (d) 0.32; (e) 0.47; and (f) 0.62 sec. Note, glass beads are initially stored within the glass bead reservoir with the sluice gate up; at later times, after the gate is withdrawn, the deforming slide moves down the 35 deg. slope while the free surface is deformed (no glued beads here). The starting time of experiments t = 0 is defined when the gate has just withdrawn into its cavity.
Fifty-eight experiments (numbered 13 to 72 in file Test_landslide_info.xlsx ) were performed (each with one replicate for the same parameters; hence for 29 independent sets of parameters) in a precision tank filled with fresh water, of useful length l = 6.27 m, width w = 0.25 m, of water depth h = 0.320 to 0.370 m (Figures 4.1), glass beads of density ρb = 2,500 kg/m3, diameter db = 4 or 10 mm, and with a total dry weight Wb = 1.5 to 2.5 kg. Upon release with a sluice gate, beads are moving down a θ = 35 deg. slope. In 20 experiments, a layer of glass beads was glue to the slope. The starting time of experiments t = 0 is defined when the gate has just withdrawn into its cavity (Figures 4.2).
During experiments, the deforming slide shape was recorded with a high-speed video camera (1,000 frames per second; see file test17_video.mp4) and time series of surface elevations were measured at 4 wave gages, WG1-WG4 (Figures 4.1). Figures 4.2 shows snapshots extracted from the video of test 17, which had parameters: h = 0.330 m; db = 4 mm, Wb = 2 kg, and no glued beads on the slope, up to t = 0.60 sec (note the starting time of each experiments, t = 0, is defined when the gate has just withdrawn into its cavity). We see that "onshore" moving waves are generated that cause runup on the slope together with "offshore" moving waves that reflect on the far end of the tank and propagate back towards the generation area. This behavior is also clearly observed in time series measured at wave gages WG1-WG4 (Figures 4.3). A detailed analysis of experimental results shows experiments are highly repeatable with almost unnoticeable differences between surface elevations for 2 replicates.
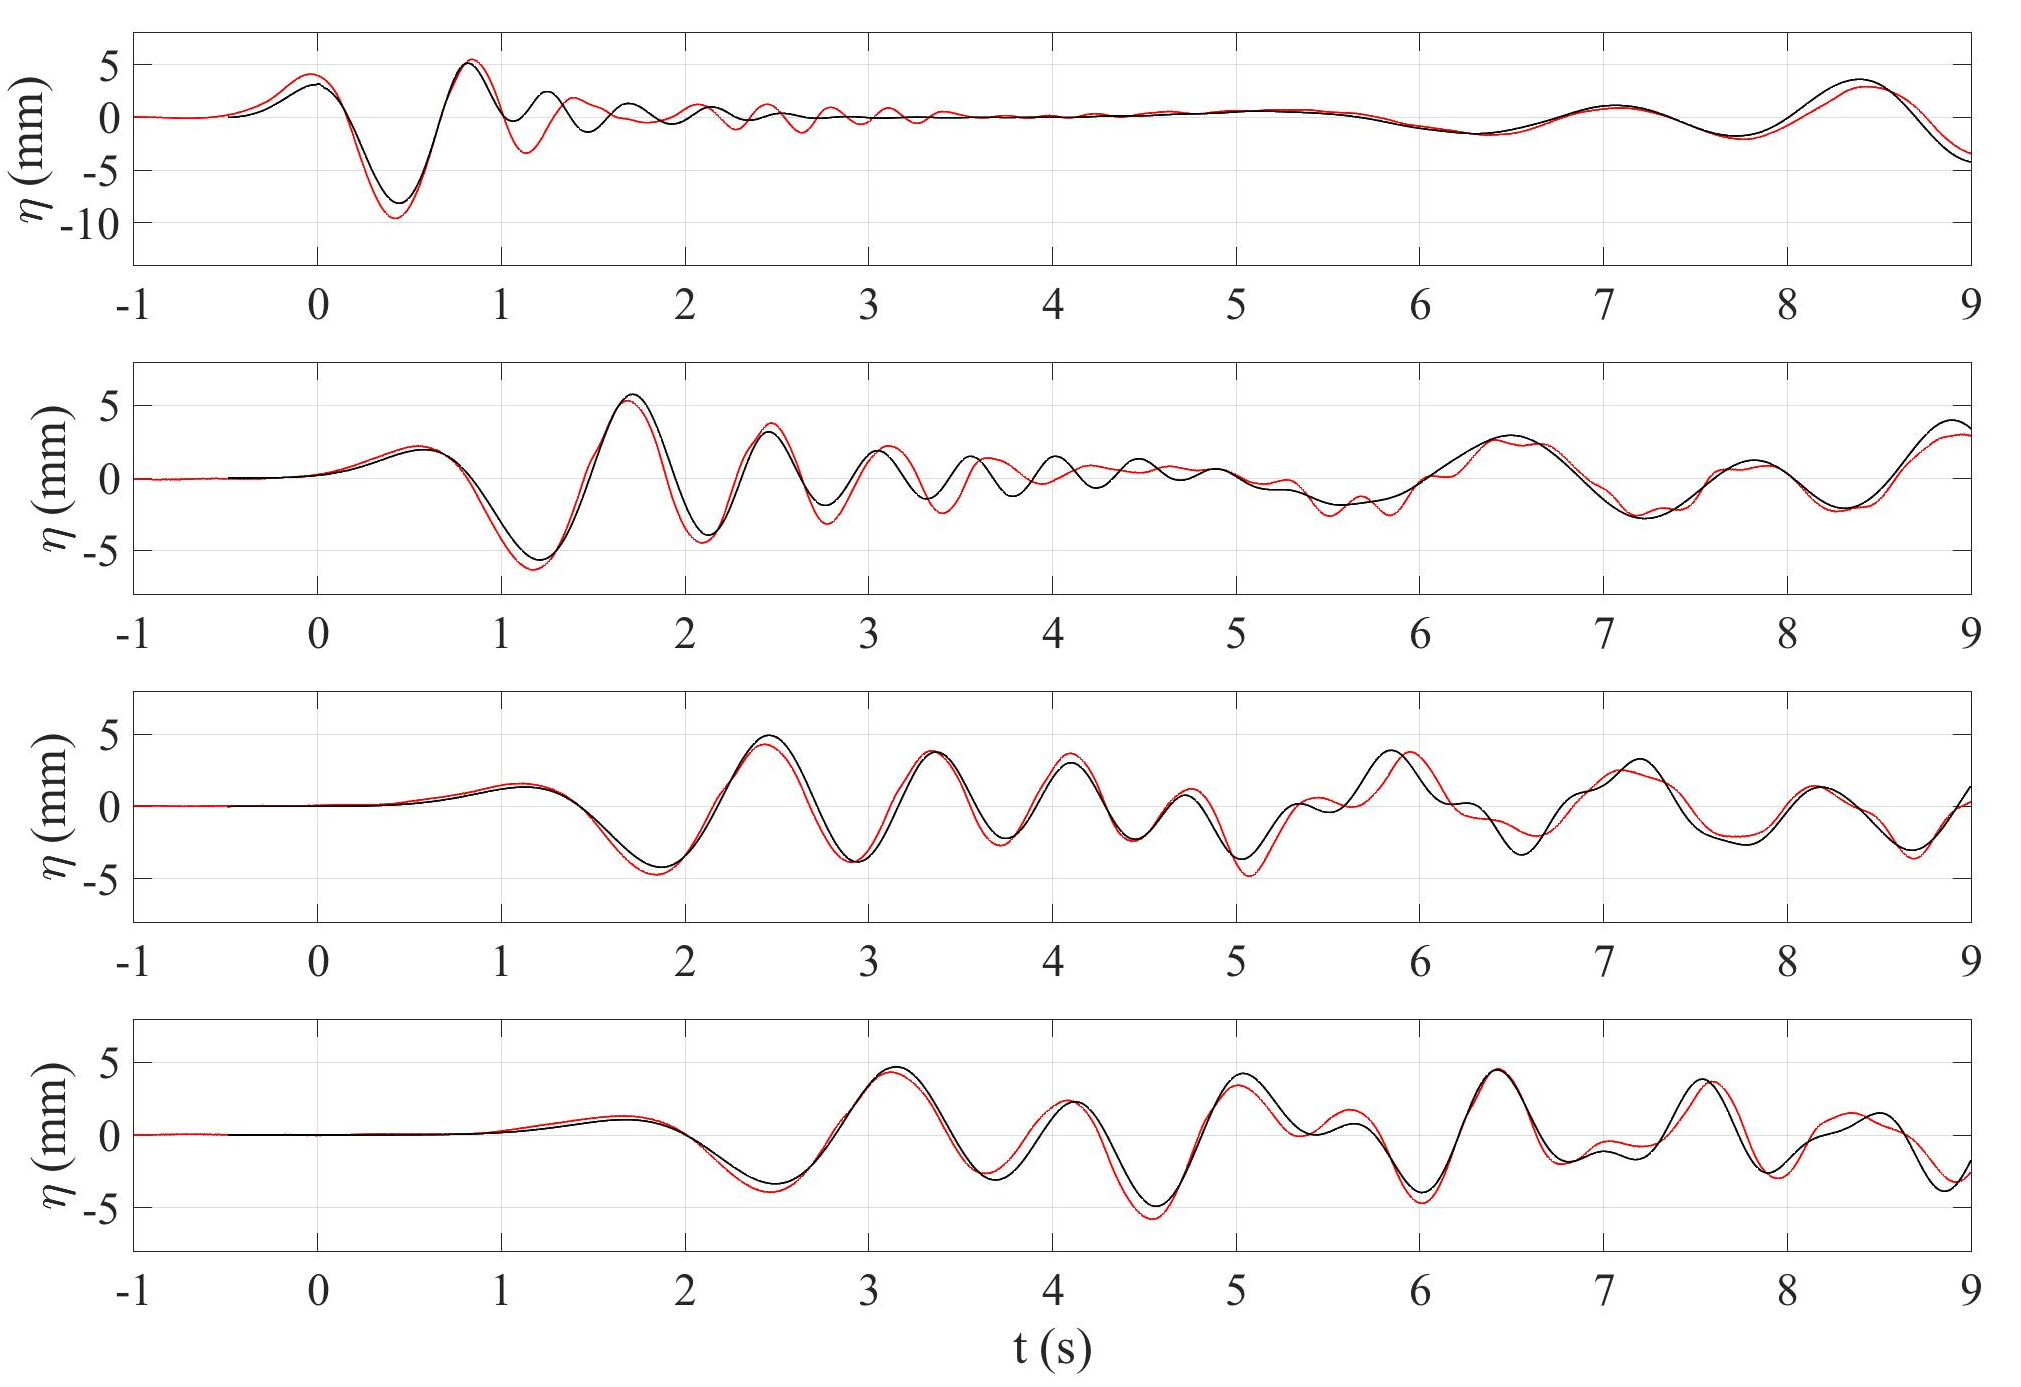
Fig. 4.3: Comparison of observed (blue) time series of surface elevation at wave gages WG1 to WG4 (Fig. 3a), from top to bottom, to those computed (red) by Grilli et al. (2016), using the model NHWAVE (Ma et al., 2012), with a dense Newtonian fluid layer underneath (Kirby et al., 2016) with: ρs = 1, 951 kg/m3, μs = 0.01 kg/(m.s) and Manning n = 0.005. Note, the origin of the time axis corresponds to the arrival of the first elevation wave at gage WG1.
Grilli et al. (2016) simulated experiments for test 17, corresponding to the case of Figs. 18 and 19, with both the heavy Newtonian fluid-NHWAVE model of Kirby et al. (2016) and the granular slide-NHWAVE model of Ma et al. (2015). Figures 4.3 shows the comparison of free surface elevations simulated with the heavy fluid model, in which an equivalent fluid-like slide density ρs = 1,951 kg/m3 was used, together with a viscosity μs = 0.01 kg/(m.s) and a Manning friction coefficient n = 0.005 (slide-to-slope friction). The agreement observed in Figures 4.3 between simulations and experiments is quite good. The equivalent density results from a weighed average within the triangular cavity of the glass beads and interstitial water density (assuming a random packing); this also led to estimating the submergence depth for this case (not measured, to d = 0.0422 m). Regarding viscosity, the selected value was based on earlier work for the estimated viscosity of Newtonian granular flows. Finally, once the viscosity selected, the Manning n coefficient value was calibrated for the deforming slide to reach the slide bottom in simulations at the same time as in experiments. A good agreement was also observed for the leading 2 waves, for the simulations with the granular slide model (not shown here), in which the granular medium was directly represented by glass beads.
Problem:
The benchmark here consists in using the above information to simulate as a minimum the glass bead experiment of test 17 discussed above, and compare the computed surface elevations to those measured at the 4 wave gages WG1-WG4 (as in Figures 4.3). The measured surface elevations for this test are provided as text files test17.txt (tab delimited) or test17.csv (comma separated variable) and the corresponding high speed video is given in file test17_video.mp4 . The data is given in format (t(s), η1 (cm), η2 (cm), η3 (cm), η4 (cm)). The entire set of experimental results for the 58 experiments, however, is provided, with parameters for each test given in file Tests_landslide_info.xlsx and the surface elevations measured for each test given in folder gages, together, with a Matlab code to extract and plot the data for each test case. This code also calculates the various dimensions of the slide itself, plus necessary parameters for computations.