Benchmark Problem #7: Field Case: Slide at Port Valdez, AK during 1964 Alaska Earthquake
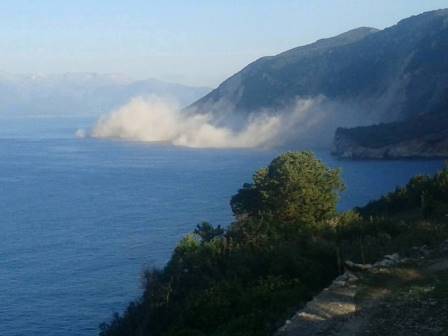
This benchmark problem is based on the historical event which occurred at Port Valdez, AK during the Alaska Earthquake of March 27, 1964, see Figure 7.1. The event has previously been in recent studies by Parsons et al. (2014) and Nicolsky et al. (2013). The second document provides an overview of the historical background and geology for the site, and is the principal source for the problem described below. Other background documents include Coulter and Migliaccio (1966), Plafker et al. (1969), and Wilson and Tørum, (1972).
Landslide at the head of the bay:
The great disaster during the Mw9.2 Alaska Earthquake happened in the dock and harbor area, where a massive submarine landslide generated a tsunami, inundating the waterfront up to two blocks inland. The pre- and post-earthquake bathymetry profiles near the site are shown in (Coulter and Migliaccio, Appendix 2, 1966). To the south of Valdez, depth changes exceeding 90 m occurred, which exceeds the depth change off Valdez itself. Thus the major part of the slide took place off the Lowe River delta. It is estimated that approximately 75 million m3 of unconsolidated deposits were transferred from the waterfront into the bay (Coulter and Migliaccio, 1966). A sequence of the waves following the landslide are reconstructed from eyewitness reports and observations. There are inherent uncertainties in the following estimates of wave time arrivals and wave heights.
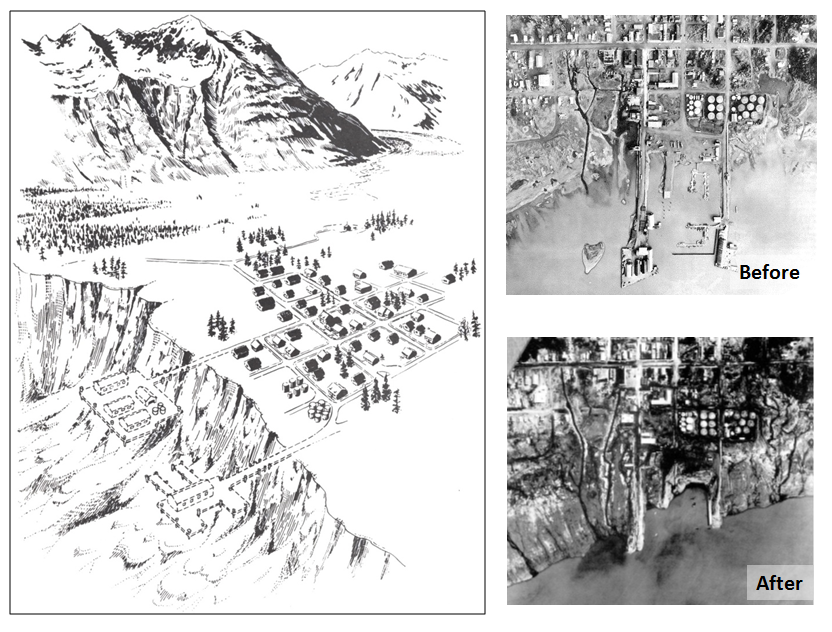
Fig. 7.1: Submerged slide area at Valdez. Dashed lines indicate dock area destroyed in earthquake. Sketch by David Laneville [from Coulter and Migliaccio, 1966].
The following account of the earthquake is taken from Wilson and Tørum, (1972) unless otherwise noted.
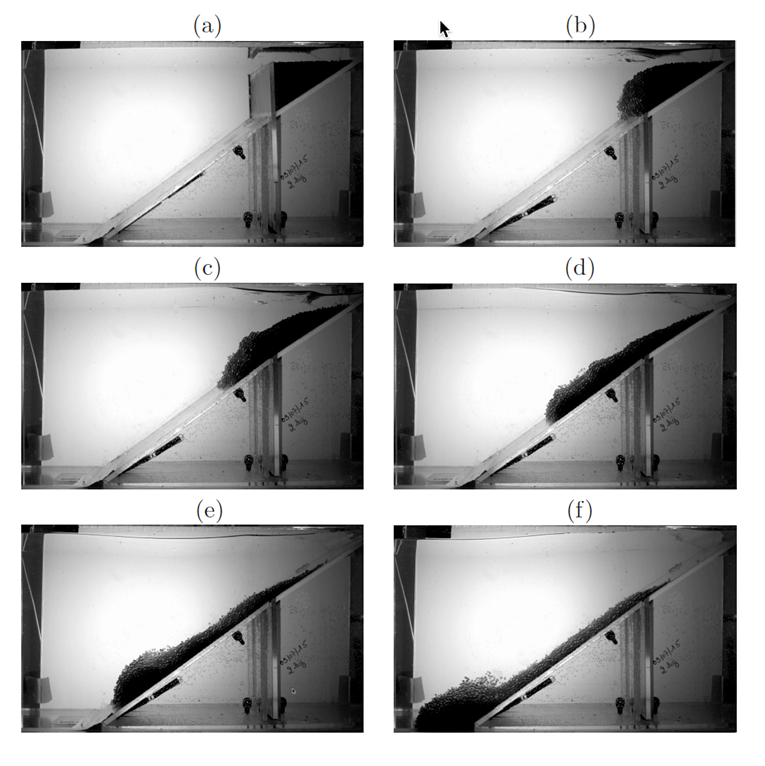
Description of the events: In the evening on March 27, 1964, the 10,815-ton M/V Chena was unloading freight at the Valdez dock Position (a) in Figure 7.2. The ship initially went astern Position (b) with the water withdrawal that accompanied the initial subsidence of the docks and then the Chena heeled to port and rose by 6-9 m on an incoming wave and bottomed at the previous location of the docks Position (c). She then came upright, took another roll to the port and was carried to the small boat harbor Positions (d-e). The Chena was momentarily aground with her stern in the wreckage of pilings. Consequently, the Chena took a violent roll to the starboard before the boat harbor began to fill with water pouring from the shore. A flux of water from the south filled the boat harbor and carried boats and buildings, dislodged by the first wave, toward the Valdez Hotel. It also lifted the Chena and enabled her to float free Positions (e-f). The water began to drain from the boat harbor and the ship came under the influence of a strong southerly current, which carried her close alongshore as in a jet stream Position (f). As the Chena was moving south, water was seen cascading over the slide scarp.
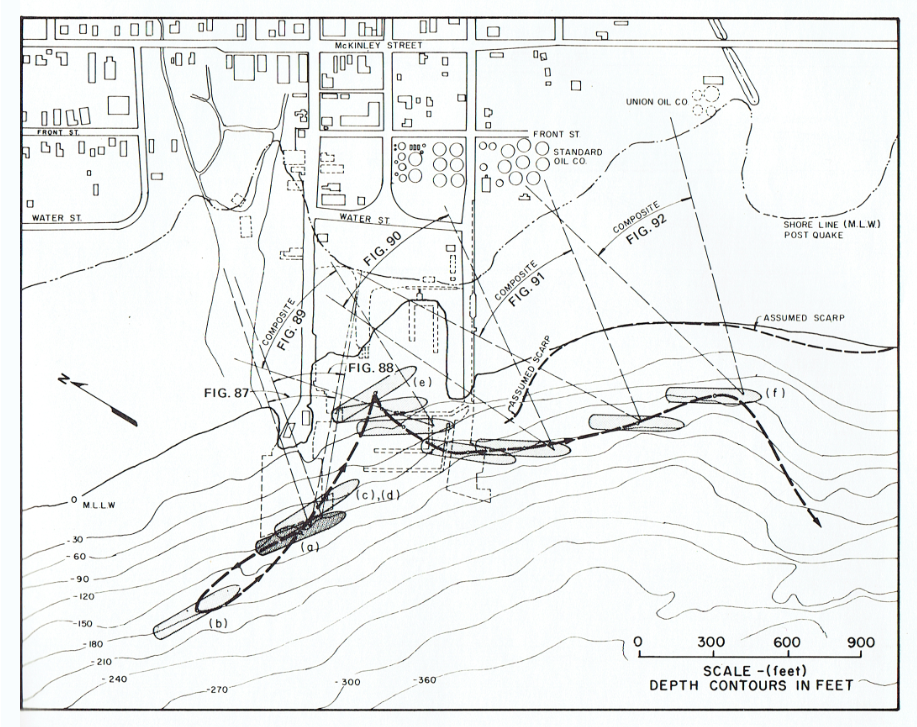
Fig. 7.2: Inferred path of the Chena from its initial position at the dock during the earquake.
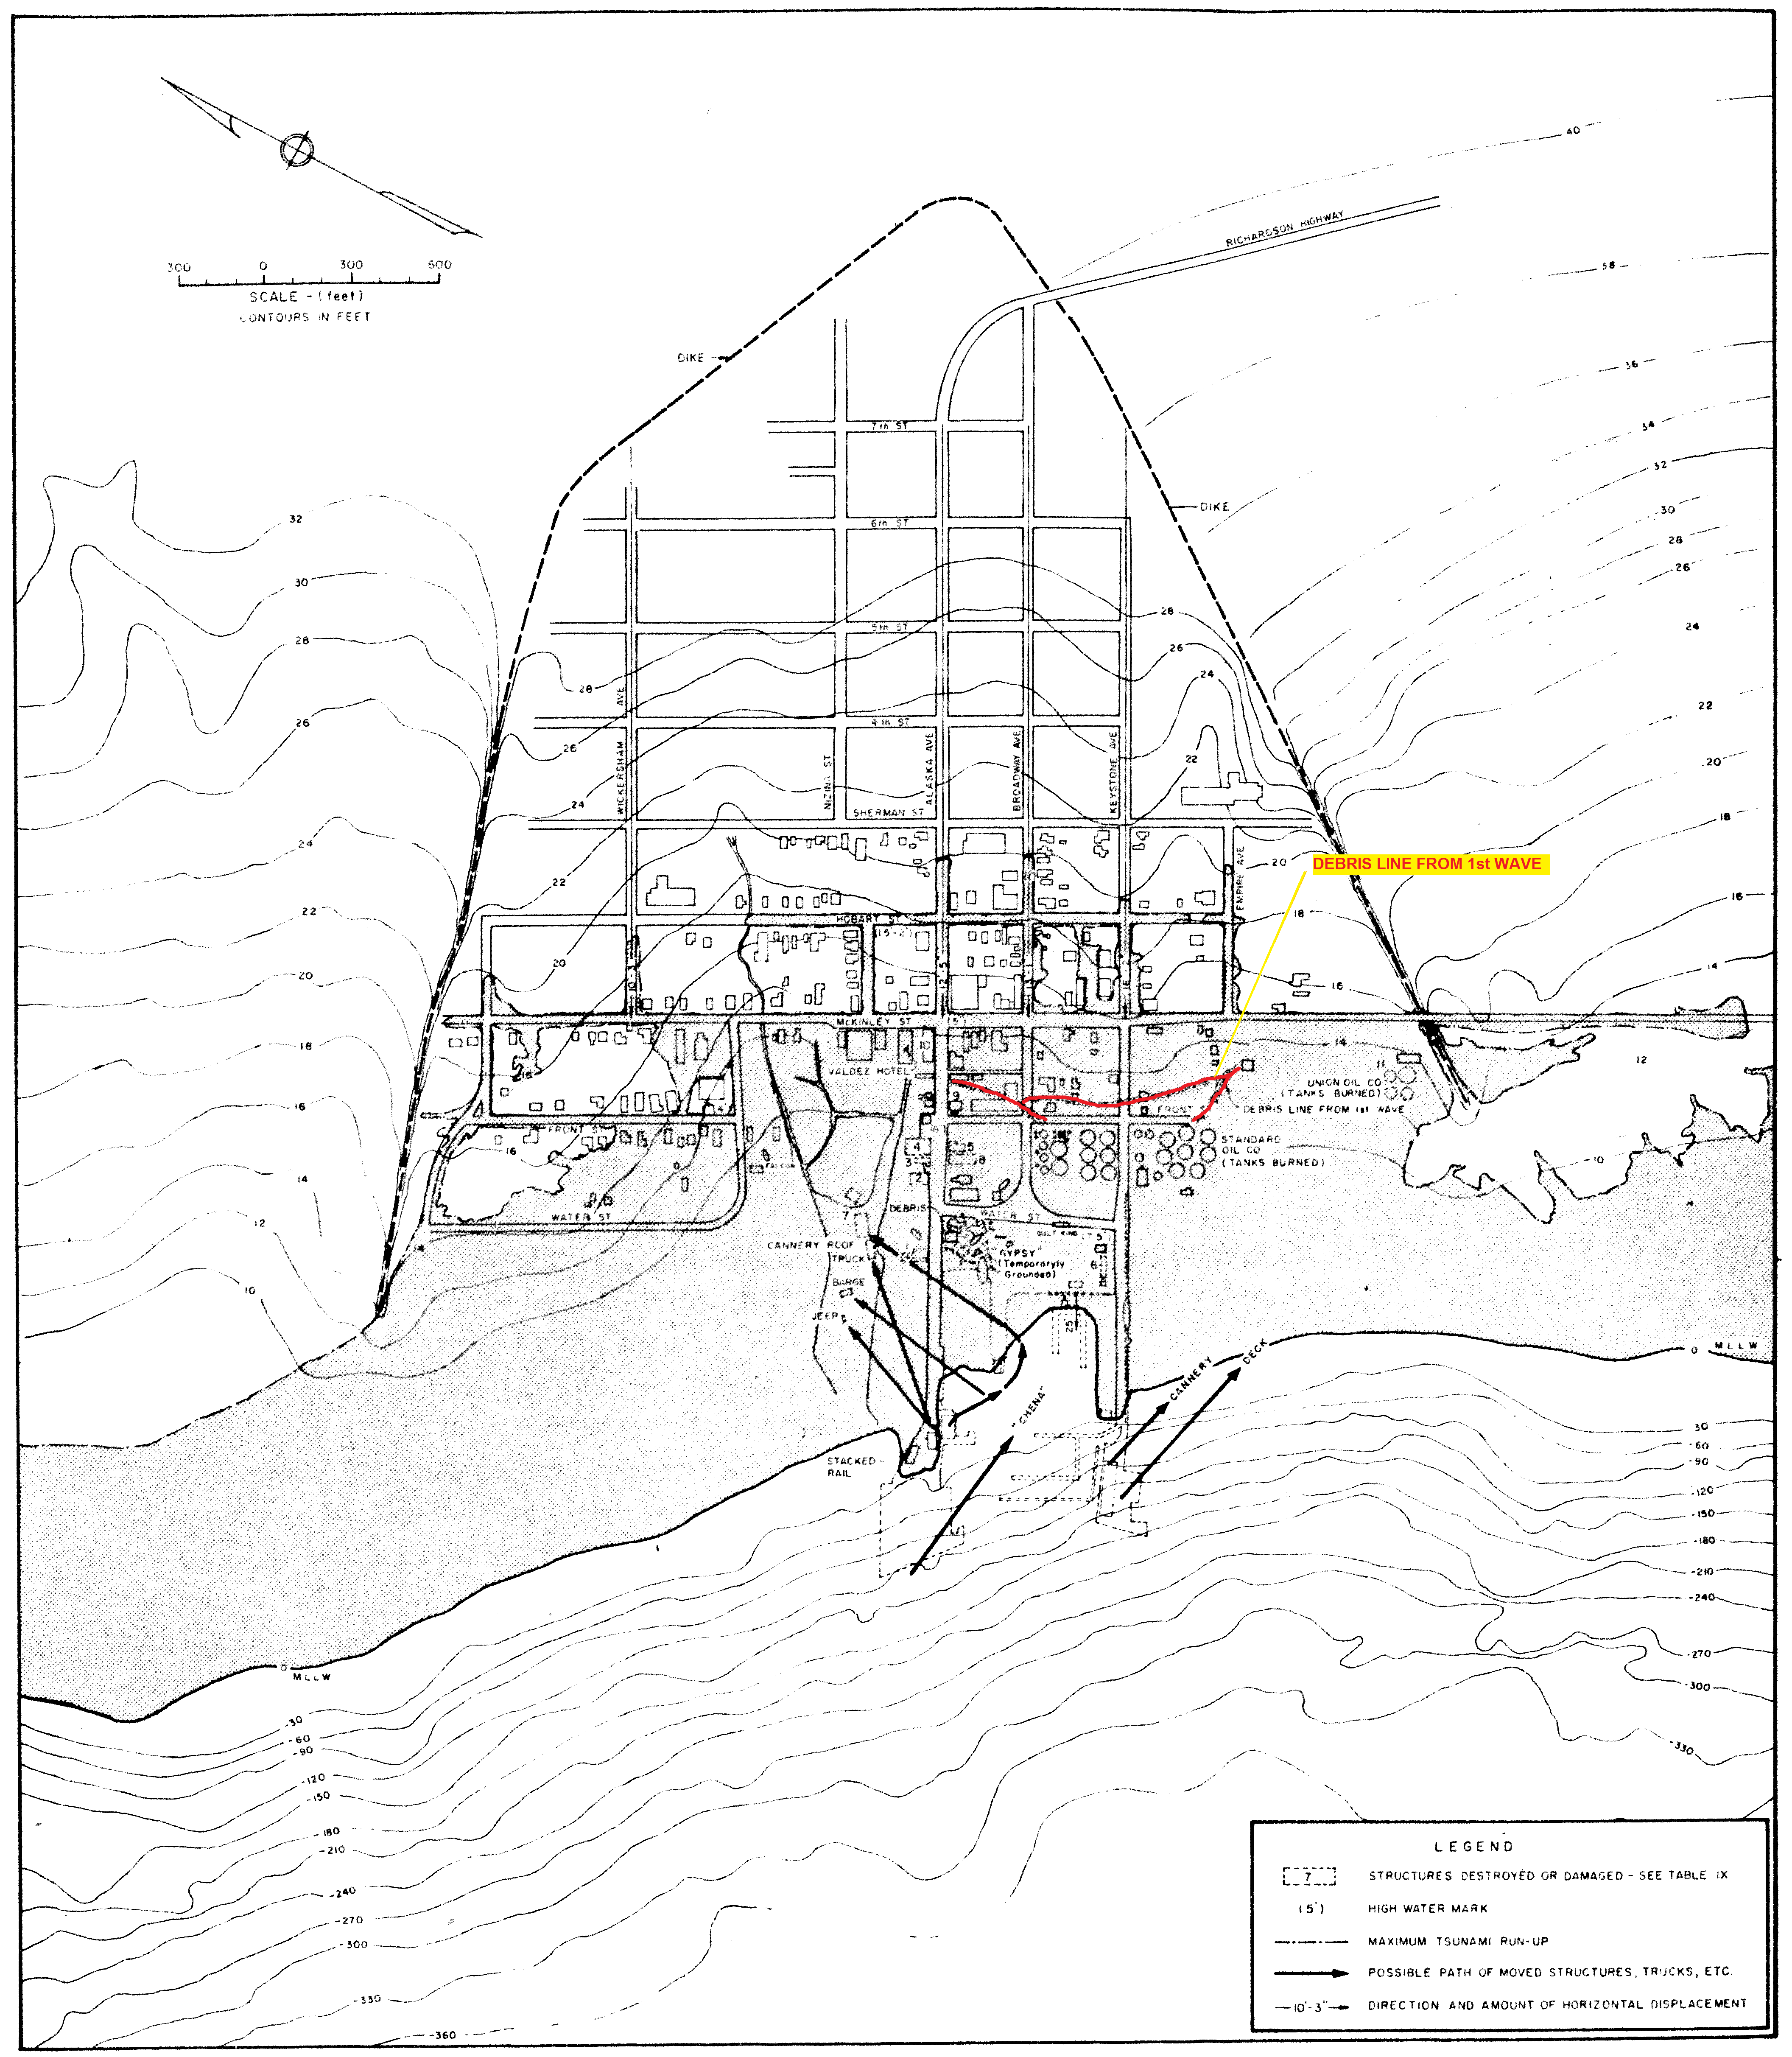
Fig. 7.3: Plan of the old town after the 1964 earthquake, showing the 1964 tsunami inundation (landslide-generated and tectonic) and post-earthquake bathymetry profiles in the MLLW datum Wilson and Tørum, (1972). The debris from the first wave is shown by the red line.
The extent of inundation by waves which lifted the Chena is hard to constrain:
- Some eyewitnesses, in attempt to reach higher ground, drove up Alaska Avenue (Figure 7.4) to the corner of McKinley Street, but a large volume of water flowing down Alaska Avenue made it impossible to proceed further. They turned right and went to the vicinity of the Standard Oil Company plant. From the vicinity of the Standard Oil Company plan, they turned up Broadway Avenue and proceeded on foot in 0.45 m deep water.
- Another eyewitness reported that a wave washed onto the main street (McKinley) on the northeast side of town within 5 minutes after the first shock, and reached two blocks inland.
It is thus reasonable to assume that at least two waves flooded the Valdez waterfront and destroyed what was left within two blocks of shore. The runup reached beyond McKinley Street, or about 300 m from the pre-earthquake shoreline at several points.
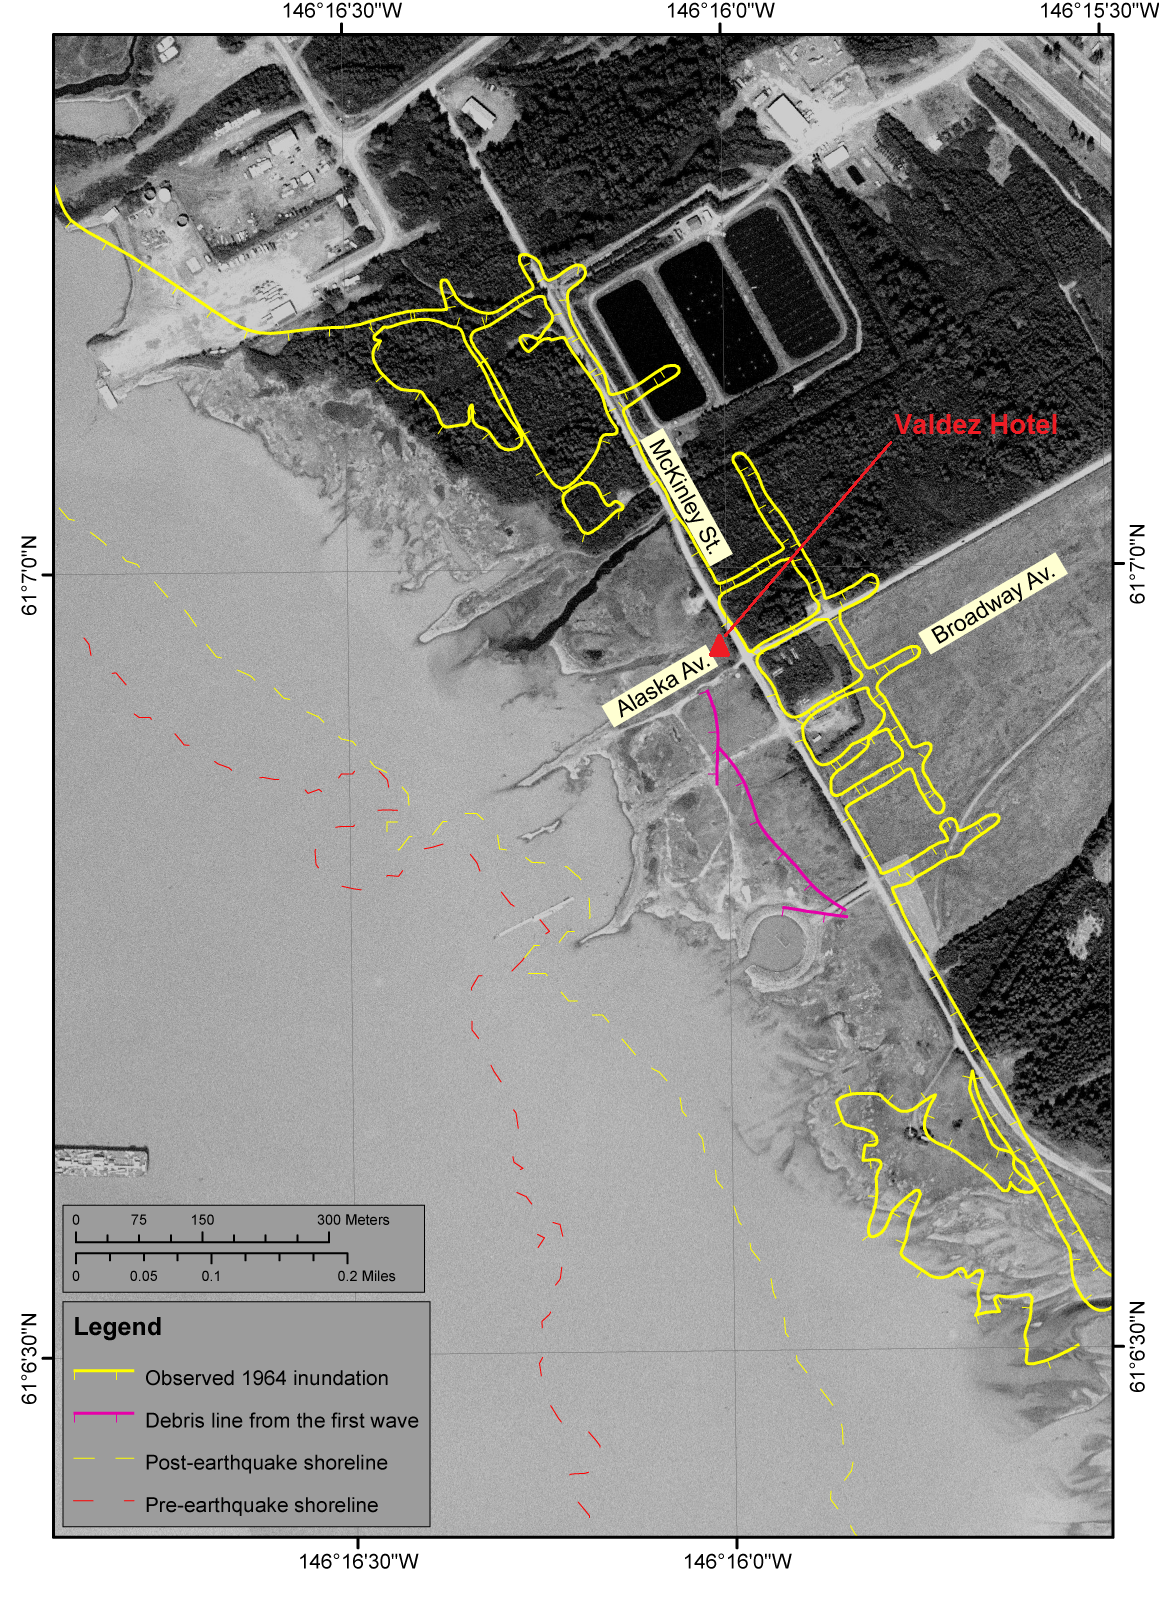
Fig. 7.4: The yellow line represents observed inundation in 1964 caused by both the
landslide- and tectonically-generated tsunamis. Hachures indicate the water side of the inundation lines.
The second wave crossed the waterfront 10-15 minutes after the first wave, carrying a large amount of the debris. It has been described as a violent surging wave only slightly smaller than the first. Water from the second wave reached a depth of 0.46 m in the Valdez Hotel on McKinley Street (Wilson and Tørum, 1972). Location of the hotel is shown in Figure 7.4 by the red triangle. It is believed that the second wave which flooded the waterfront originated at the other side of the Port Valdez near the Shoup Bay moraine.
Landslide at the Shoup Bay moraine:
There were no eyewitnesses to waves that struck the shore at other locations along Port Valdez. However, the inundation line was evident from scattered debris and marks on fresh snow. Figure 7.5 shows the observed runup around Port Valdez. The highest location obliterated by waves was near the large, abandoned Cliff Mine. According to Plafker and others (1969), the waves deposited driftwood at points 52 m (170 ft) above sea level and splashed silt and sand up to an elevation of 67 m (220 ft). Directly across from the Cliff Mine in Anderson Bay at the south shore of Port Valdez, the waves ran up to 24 m (78 ft) above the water level and destroyed a small fishing camp. All structures of the camp were swept away, leaving only the driven piling foundations. Its sole inhabitant, Harry Henderson, was missing and presumably drowned in the violent local waves that struck Anderson Bay.
The abandoned Dayville cannery at Jackson Point, 8 km (5 mi) east of Anderson Bay, was also extensively damaged by waves that reached as high as 9.5 m (31 ft). Elsewhere along the shore, violent waves broke spruce trees with a diameter of 0.6 m (2 ft) at elevations as high as 31 m (101 ft) and deposited barnacle-covered boulders estimated to weigh 760 kg (1,700 lb) at points 27 m (88 ft) above the shoreline. The
waves that moved westward from Port Valdez overtopped and destroyed the Valdez Narrows navigation light (shown in Figure 7.5 by the red triangle) situated on top of a reinforced concrete pedestal 11 m (36 ft) above the lower low water level. Problem: The benchmark here will consist in simulating the extent of inundation for two slide events (at the head of the bay and at the Shoup Bay moraine), based on before and after bathymetry data, eye-witness observations of the event, and observed runup distribution.
For the slide at the head of Port Valdez (HPV64), it is recommended
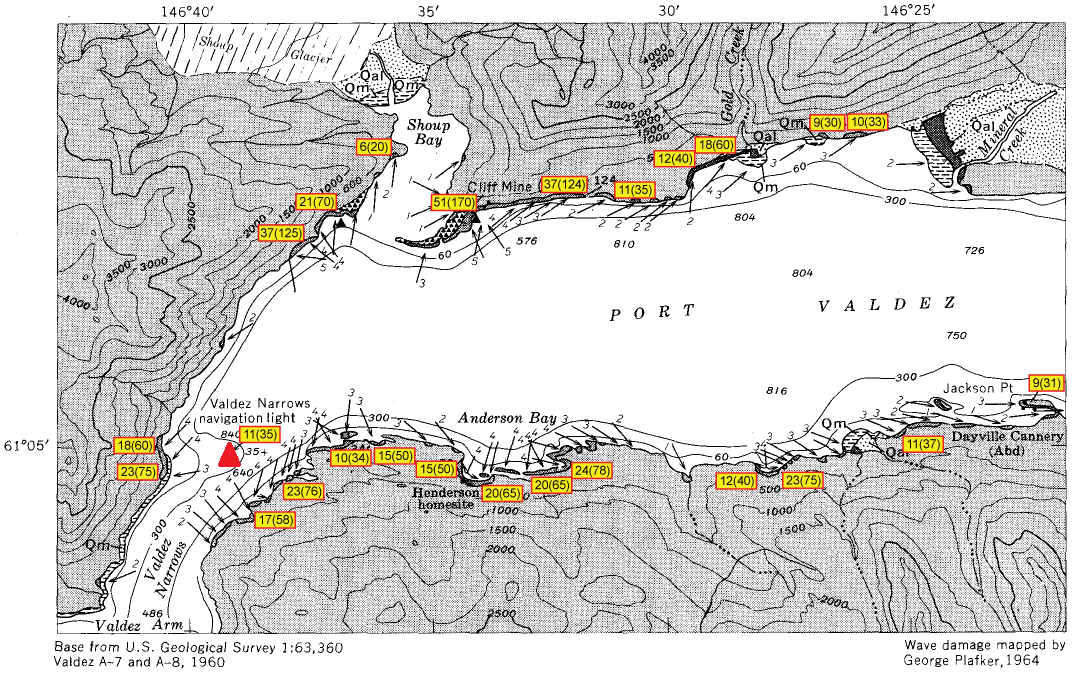
Fig. 7.5: Distribution and intensity of wave damage in Port Valdez after the 1964 earthquake, mapped by L. Mayo and
G. Plafker. Inferred direction of the wave arrival is shown by arrows. Relative magnitude of damage is indicated by
a numeral at the base of an arrow, based on the scale: 1-runup about 1-2 m (0-6 ft); 2-runup 8 m (25 ft) on steep
shores; 3-maximum runup 17 m (55 ft); 4-maximum runup 21 m (70 ft); 5-maximum runup 52 m (170 ft). Yellow
boxed numerals onshore next to shaded areas at edge of water provide runup height in meters (and feet) above sea level
at time of the earthquake. The base map and description of the damage are from Plafker and others (1969).
For the slide at the Shoup Bay moraine (SBM64), it is recommended
- to simulate an extent of inundation around Port Valdez and reproduce 20+ m runup at the Anderson Bay
- to simulate 10+ m wave inundating the navigation light, shown in Figure 7.5 by the red triangle, in Valdez Narrows
- to simulate 0.5m wave in the Valdez Hotel, shown in Figure 7.4 by the red triangle, located in the head of Port Valdez
Data:
The post-earthquake bathymetry together with the slide thicknesses, shown in Figure 7.6, could be downloaded as a single zip file here. The archive also contains shape files delineating an extent of the observed inundation at the head of Port Valdez and location of the debris from the first wave. The Matlab script reads all available data and plots contours of the slide thicknesses (Figure 7.6) as well as the extent of inundation Figure 7.7 near the head of Port Valdez.
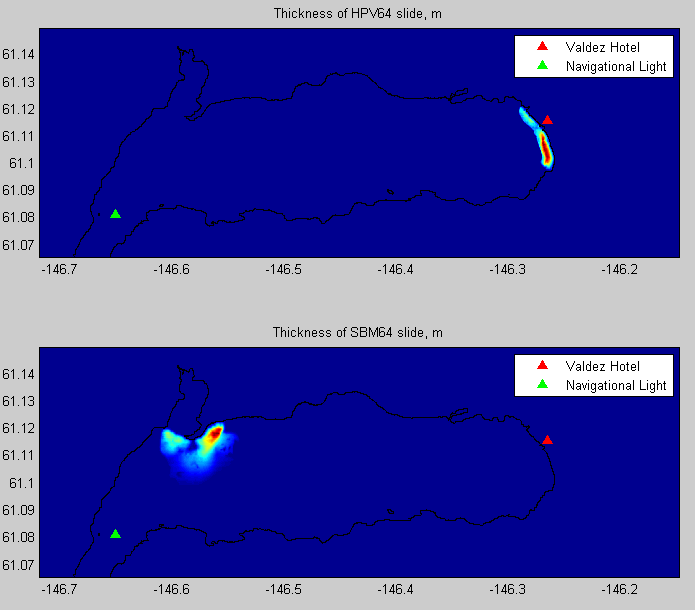
Fig. 7.6: Top: The reconstructed initial thickness of the old town (HPV64) slide during the 1964 earthquake. Bottom: The reconstructed initial thickness of the Shoup Bay (SBM64) slide during the 1964 earthquake.
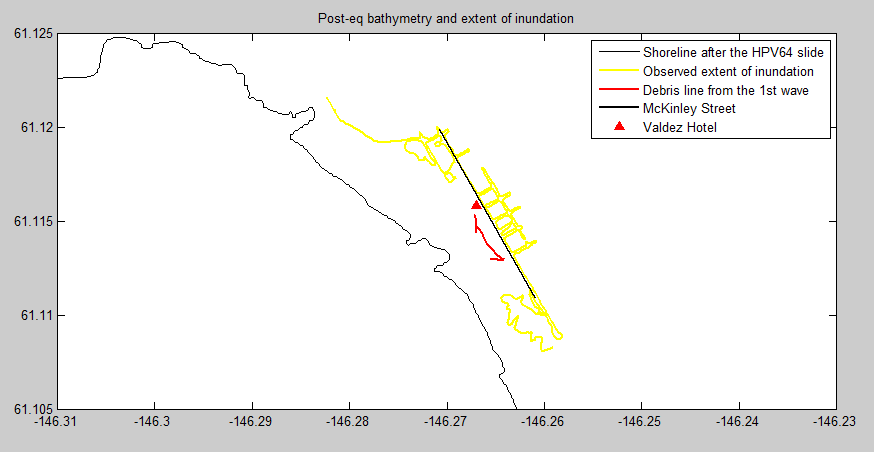
Fig. 7.7: Digitized extent of inundation, location of the debris and location of McKinley Street.