Benchmark Problem #1: Two-dimensional submarine solid block
This benchmark problem is based on the 2D laboratory experiments of Grilli and Watts (2005) , which were performed at the University of Rhode Island. The geometry of the slide is shown in Figure 1.1
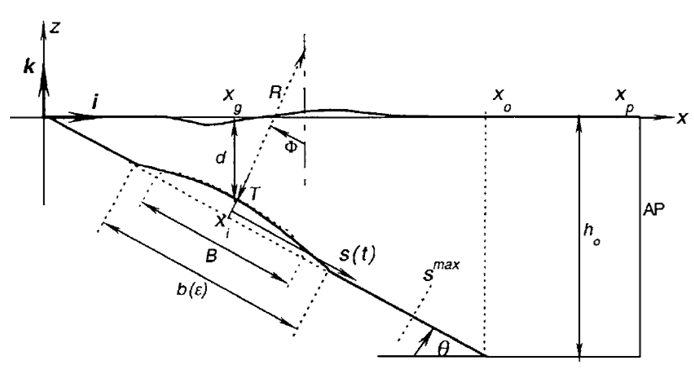
Fig. 1.1: Sketch of main parameters and variables for wave generation by 2D slide. [from Grilli and Watts, 2005]
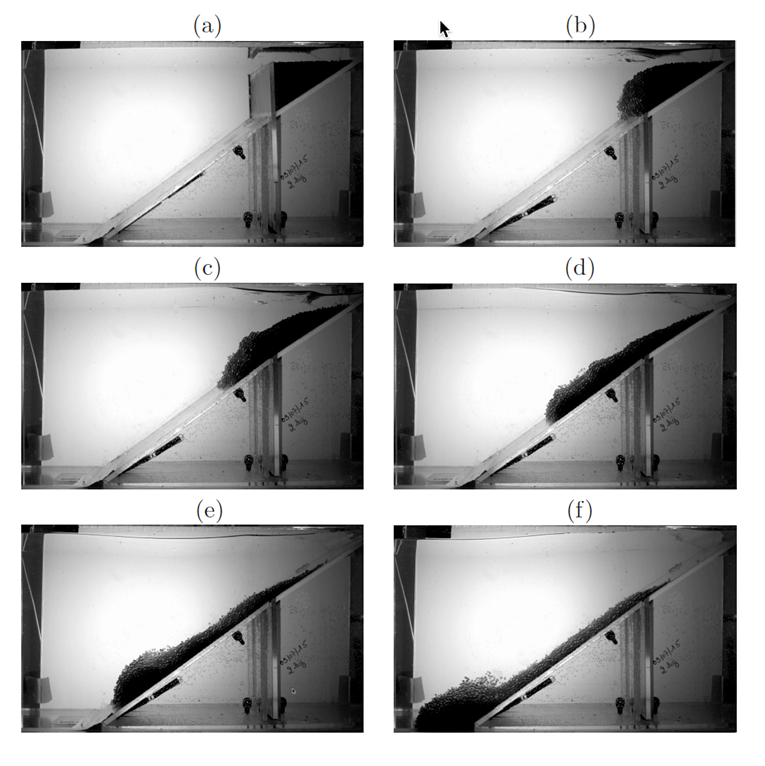
Fig. 1.2: Wave generation by 2D slide (Figure 1.1). Experimental set-up, with views of sidewalls, capacitance wave gages, and lead-loaded rolling semi-elliptical slide model
Grilli, S.T. and P. Watts, 2005. Tsunami generation by submarine mass failure Part I : Modeling, experimental validation, and sensitivity analysis. J. Waterway Port Coastal and Ocean Engineering, 131(6), 283-297.
[local pdf]
The 2D slide model is semi-elliptical, lead-loaded, and rolling down a smooth slope with θ = 15 deg. (2 mm above the slope), in between two vertical side walls, 20 cm apart Figure 1.2. The water depth is h0 = 1.05 m. Melted lead was poured in a central cavity in the model, to achieve an average density 1.806 in the fresh water tank, corresponding to ρl =1,850 kg/m3 in sea water of density ρw = 1,025 kg/m3. The model dimensions were length B = 1 m, maximum thickness T = Tref = 0.052 m, and width w = 0.2 m. The model initial submergence d was varied in experiments and the free surface elevation recorded at 4 capacitance wave gauges installed at locations: x = 1.175, 1.475, 1.775, 2.075 m, the first location being nearly identical to xg = 1.168 m Figure 1.1.
A micro-accelerometer was embedded at the model center of mass and inclined perpendicular to the slope, which recorded the slide acceleration in experiments. The latter was twice integrated to obtain the slide center of mass motion as a function of time S(t). This motion was found to be highly repeatable in replicates of experiments and through curve fitting, after a short acceleration ramp-up over time ti (see details in Grilli and Watt's (2005) Appendix), to match well the theoretical law of motion:
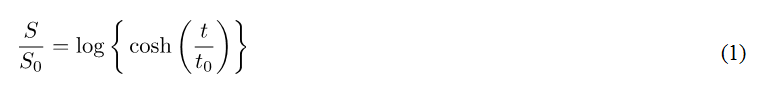
with
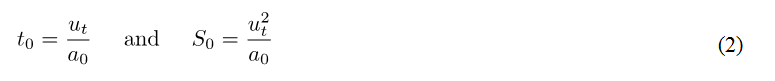
the characteristic time and distance of motion, respectively, defined as a function of ut the terminal slide velocity and a0 the slide initial acceleration. For d = dref = 0.259 m, measurements yielded : a0 = 0.75 m/s2, ti = 0.09 s, t0 = 1.677 s, and S0 = 2.110 m.
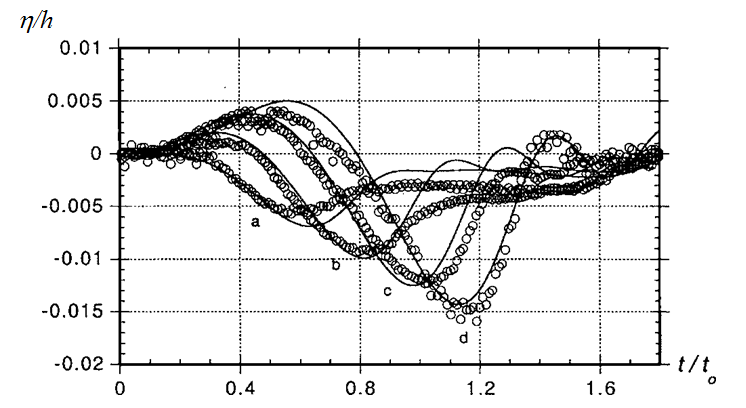
Fig. 1.3: Wave generation by 2D slide (case of Figure 1.1-Figure 1.2), for d = dref = 0.259 m. Time series of non-dimensional surface elevation η/h0, in laboratory experiments (o) and simulations (-), measured/computed at 4 wave gauges g0-g1 located at x/h0 = a: 1.175, b:1.475, c:1.775, d: 2.075. Horizontal axis is non-dimensional time t/t
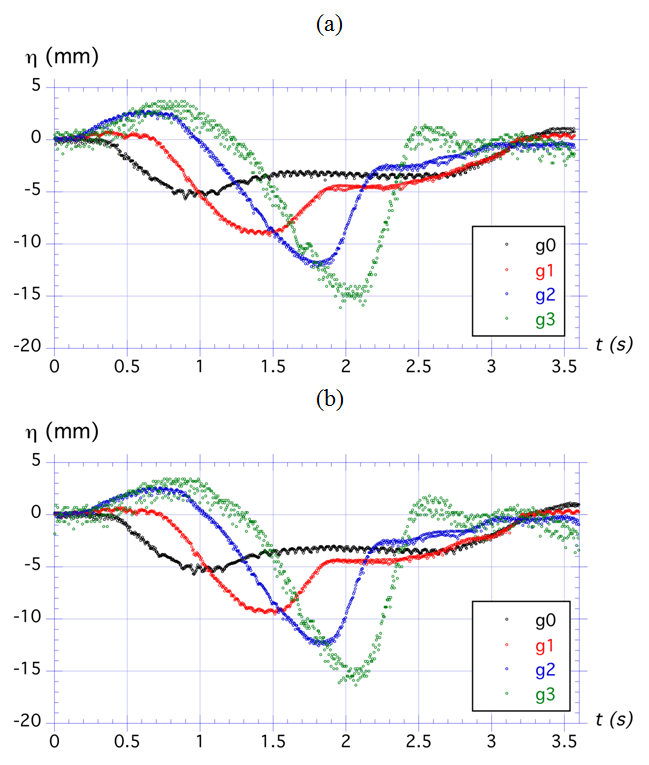
Fig. 1.4: Wave generation by 2D slide (case of Figure 1.1-Figure 1.2). Two sets of experimental results (a: trial 4 and b: trial 5) from Grilli and Watts' (2005) 2D slide experiments (case of Figure 1.1-Figure 1.2), for d = dref = 0.259 m (Figure 1.3). Labels g0 to g3 denote measurements of surface elevation at gages located at (Figure 1.1) x (m) = 1.234, 1.549, 1.864, 2.179.
Figure 1.3, from Grilli and Watts (2005), shows a comparison for this case of experimental results with numerical simulations (Fully Nonlinear Potential Flow BEM model) for the surface elevation at the 4 selected wave gages g0-g1 located at (Figure 1.1) x/h0 = a: 1.175, b: 1.475, c: 1.775, d: 2.075 or x = 1.234, 1.549, 1.864, 2.179 m. The original data for two replicates of one of Grilli and Watts' experiments was located and plotted in Figure 1.4 (trials 4 and 5) of this experiment. Because there were a few replicates of each experiment, those in Figure 1.4 are not exactly the same data as shown in Figure 1.3, which may have resulted from averaging of replicates of the experiment. Also, there appears to be some high-frequency noise in the original data (which in the data files is given at 200 Hz, unlike the 100 Hz noted in the paper), which may have been filtered out to produce Figure 1.3.
Data:
Time series of raw data from Figure 1.4 are provided in Matlab formatted mat files bench1_trial4.mat and bench1_trial5.mat and in excel format as Bench1_trial4.xlsx and Bench1_trial5.xlsx.
Problem:
The benchmark here consists of using the above information on slide shape, density, submergence and kinematics, together with reproducing the experimental set-up to simulate surface elevations measured at the 4 wave gages (average of 2 replicates of experiments), such as shown in Figure 1.4, and present a comparison model-experiments similar to Figure 1.3.