Benchmark Problem #3: Sediment erosion and deposition in a laboratory flume
Benchmark problem 3 includes a set of experiments conducted in the CRIEPI wave flume and described in publications by Yoshii et al. (2017) (and supplement) and Yoshii et al. (2018) (and supplement). A total of 13 experiments were conducted, referred to as tests C1 - C13. For each test, the flume was configured with a contraction section to aid in amplifying incident waveheight and velocities, followed by a parallel set of narrower channels, one with a fixed bed and one with an erodible sand bed (Fig. 3.1). The fixed bed was utilized to collect a spatially dense set of surface elevation and velocity measurements, while the temporal measurements in the movable bed section consisted of a staggered set of concentration or velocity and elevation measurements.
Yoshii et al (2017) describe tests C1 - C5, which were conducted with a nearshore slope of 1/50 extending both seaward and landward of the still water shoreline (x=40m), with the movable bed section extending from a depth of 0.8m (x=0m) landward for 50m or to a point 10m landward of the shoreline. Tests C2-C5 also included a sand dune feature constructed on the landward side of the still water shoreline (Fig. 3.1).
Yoshii et al (2018) describe tests C6 - C13, which were conducted with a nearshore slope of 1/50 on the seaward side of the shoreline, from a depth of 0.8 m (x=0m) to the shoreline position at x=40m. Two slope configurations were considered landward of the still water shoreline, with tests C6-C10 using a slope of 1/100, and tests C11-C13 using a flat bed landward of the still water shoreline (Fig 3.2).
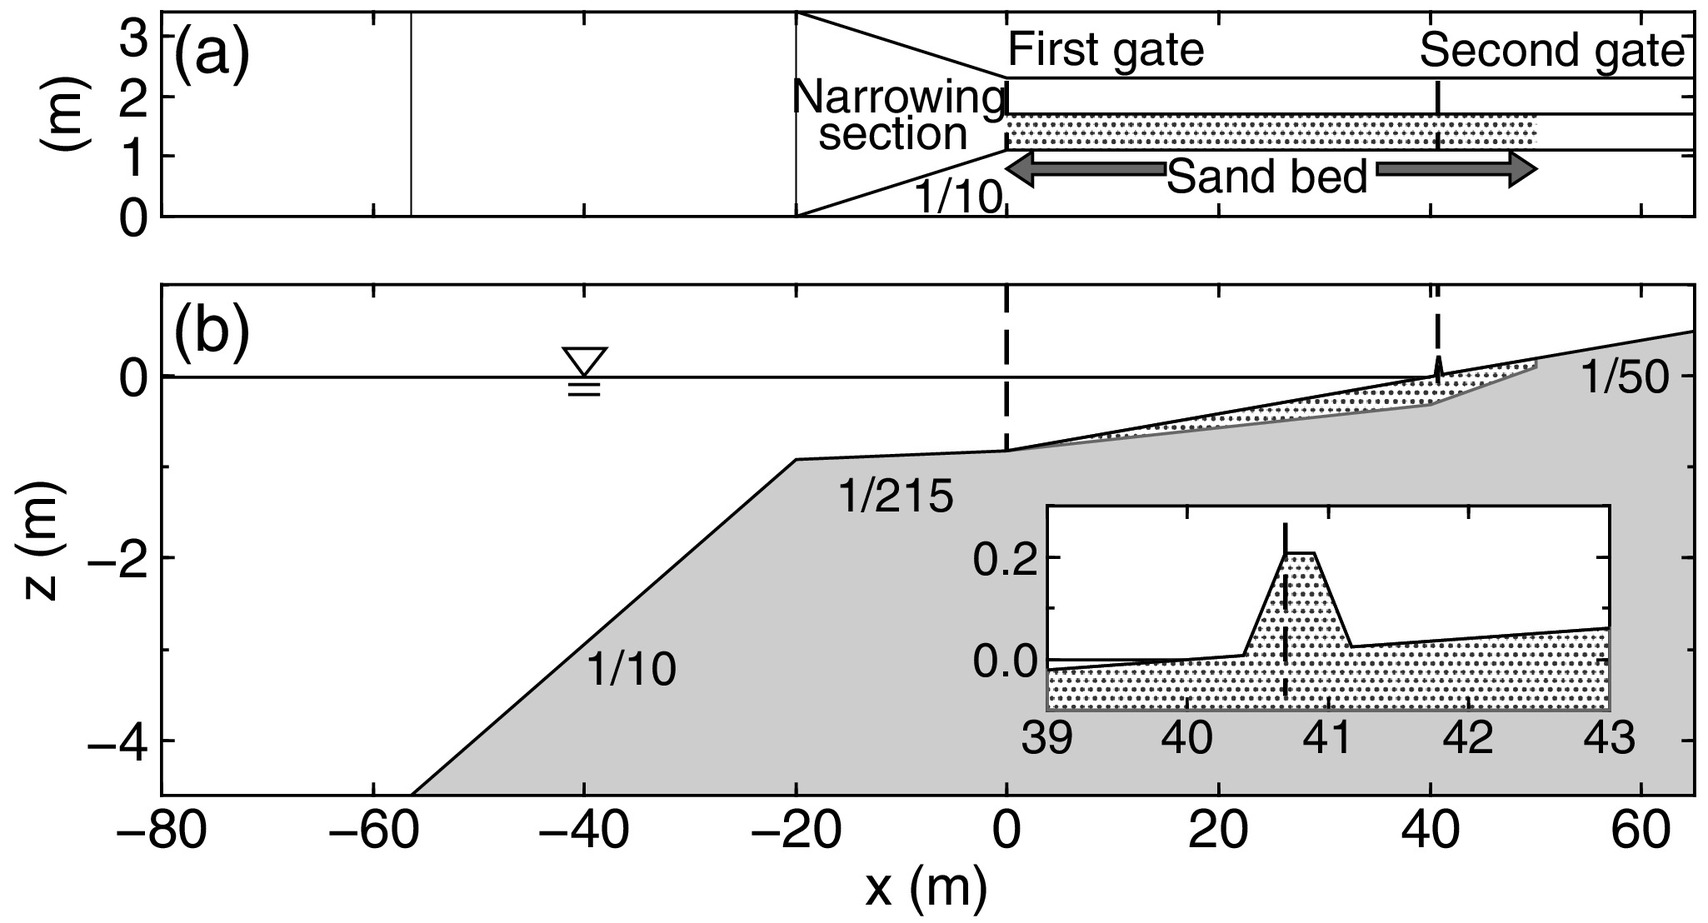
Fig 3.1: Experimental configuration for cases C1 - C5 of Yoshii et al (2017).
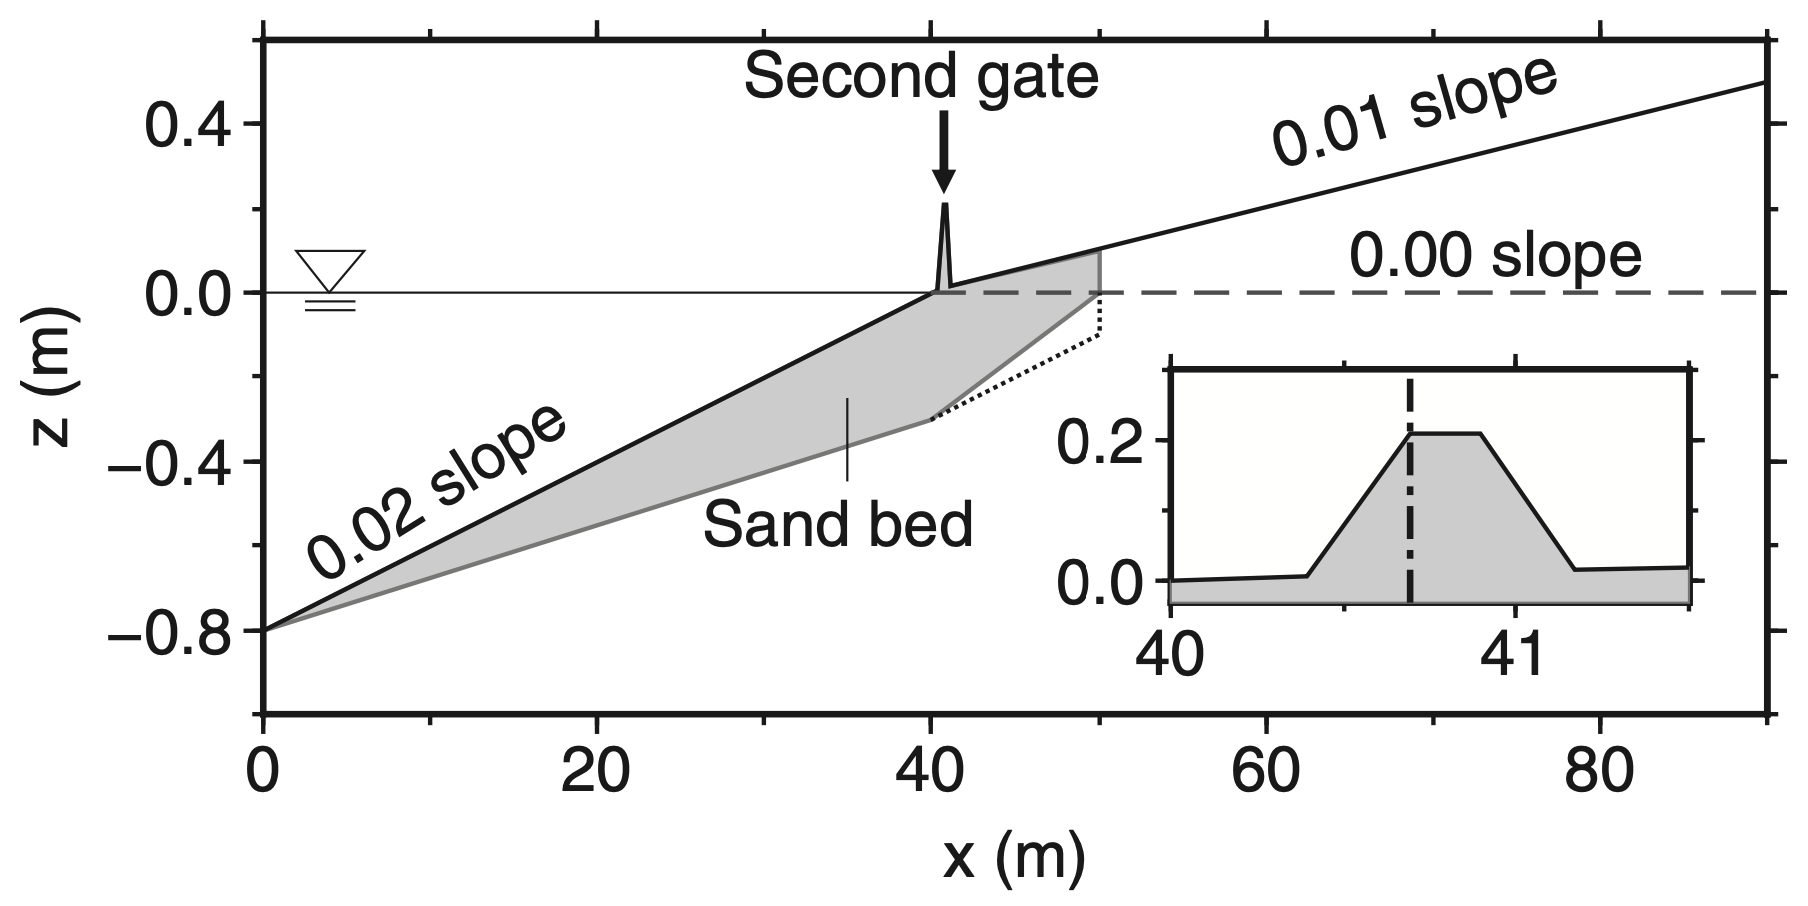
Fig 3.2: Experimental configuration for cases C6 - C13 of Yoshii et al (2018).
A comprehensive archive of the data from tests C1-C13 is available at https://data.mendeley.com/datasets/7348bmbbsx The readme file for the archive is provided separately here . For each test, the data files are organized according to the along-tank, x-direction location, with separate files for each x location. The original files are in csv format. In order to facilitate using the data, the principle results for each test have been organized into Matlab .mat files C1.mat - C13.mat, which are collected in a zip file. (Tests C5 and C10 consist only of sediment trap experiments and do not appear in this archived set.) Each of these mat files contains the following variables:
- fixed_data - dimension Nt by 4 by Nx, where Nt is the number of time samples, Nx is the number of x direction measurement locations, and the remaining 4 columns contain values of measurement time, surface elevation, horizontal velocity u and vertical velocity w.
- movable_data - dimension Nt by 2 by 2, where the third dimension indicates two measurement locations at x=36m and x=44m, and the two columns indicated by the second dimension are measurement time and sediment concentration.
- topo_data - dimension Nb by 4, where columns 1-4 are measuring locations (m), initial bed elevation (m), final bed elevation (m) and change in elevation (m) at Nb locations spaced at 1 mm increments along the movable bed.
- xf - Nx x locations (m) for the fixed bed measurements.
For each test, the fixed_bed data has an initial measurement point at x=0.5m. This is intended to be the incident wave boundary condition for calculations. The data sets do not provide wavemaker conditions or incident wave conditions in the wider portion of the flume. Yoshii et al (2017) show a comparison of input conditions for the wavemaker and resulting surface elevation measurements at x=0.5m for cases C1 - C5 (Fig. 3.3)
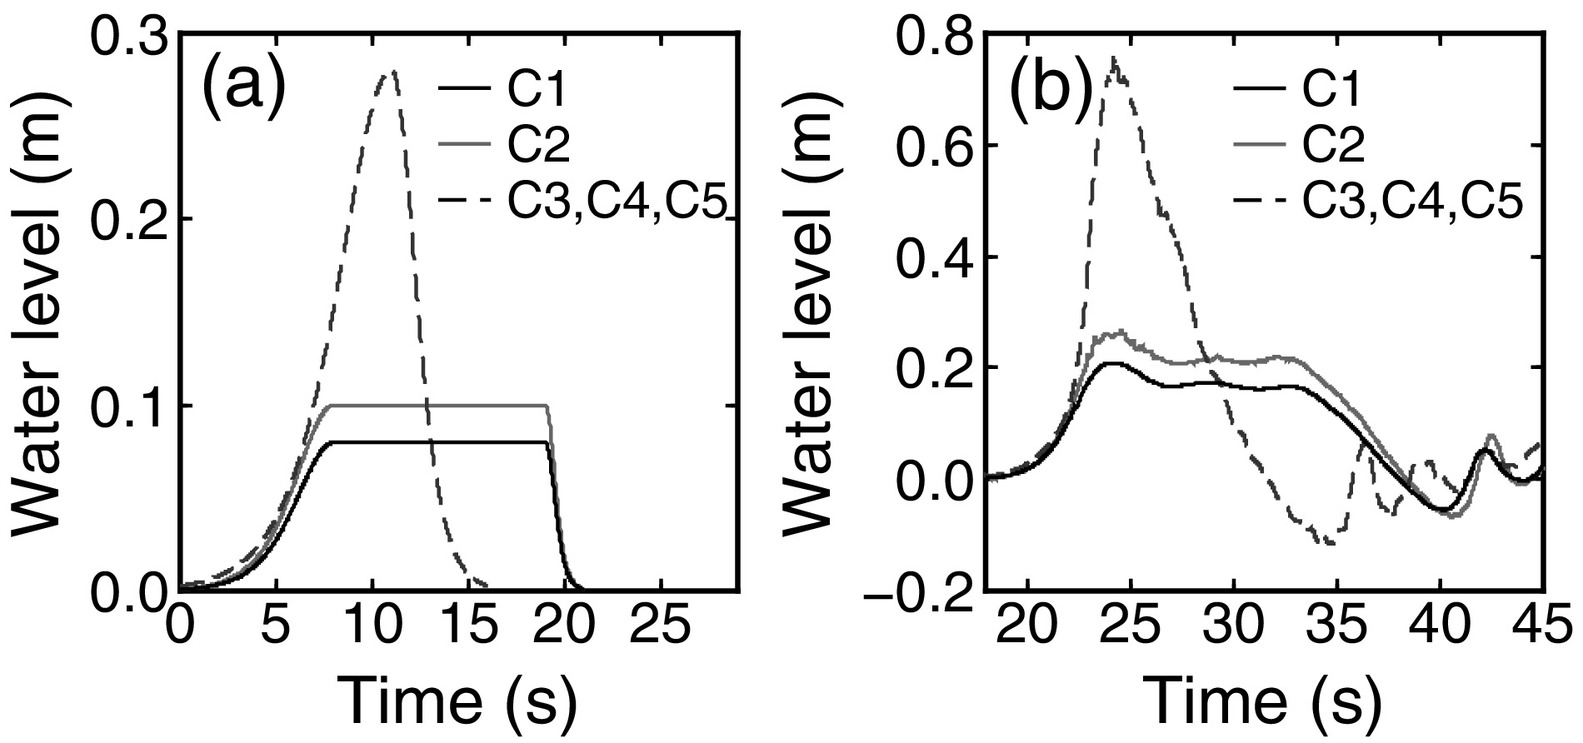
Fig 3.3: (a) Input waves for the wave generator and (b) the progressive waves observed at x=0.5 m (Yoshii et al. (2017), Fig. 3).
The original data set provides additional information on sampled grain size distributions in deposits both in the vertical and cross-shore directions which would be useful information for modelers using codes which are able to account for multiple grain size components in the transport process. This additional data has not been processed for distribution here.
Data Provided:
The data provided for modelers to use in this exercise consists of the .mat files for experiments C1 - C4, C6 - C9 and C11 - C13 described above and contained in the file Archive.zip
The Benchmark Problem:
It is suggested to consider tests C6 (with no dune) and C7 (with a dune included) to first test model configurations, and then turn to test C8 (with a dune included) which considers the higher, peaked incident wave and produces more intense transport. The main result of the benchmark test, which will be compared across all models, is the comparison between initial and final bed elevations described as "topo_data" above. Any additional results describing the time sequence of local erosion and deposition processes will be considered as a means of testing the behavior of the various models used. No experimental data on this sequencing of erosion and deposition is directly provided.