Benchmark Problem #1: Crescent City Harbor, CA response to 2011 Tohoku tsunami event.
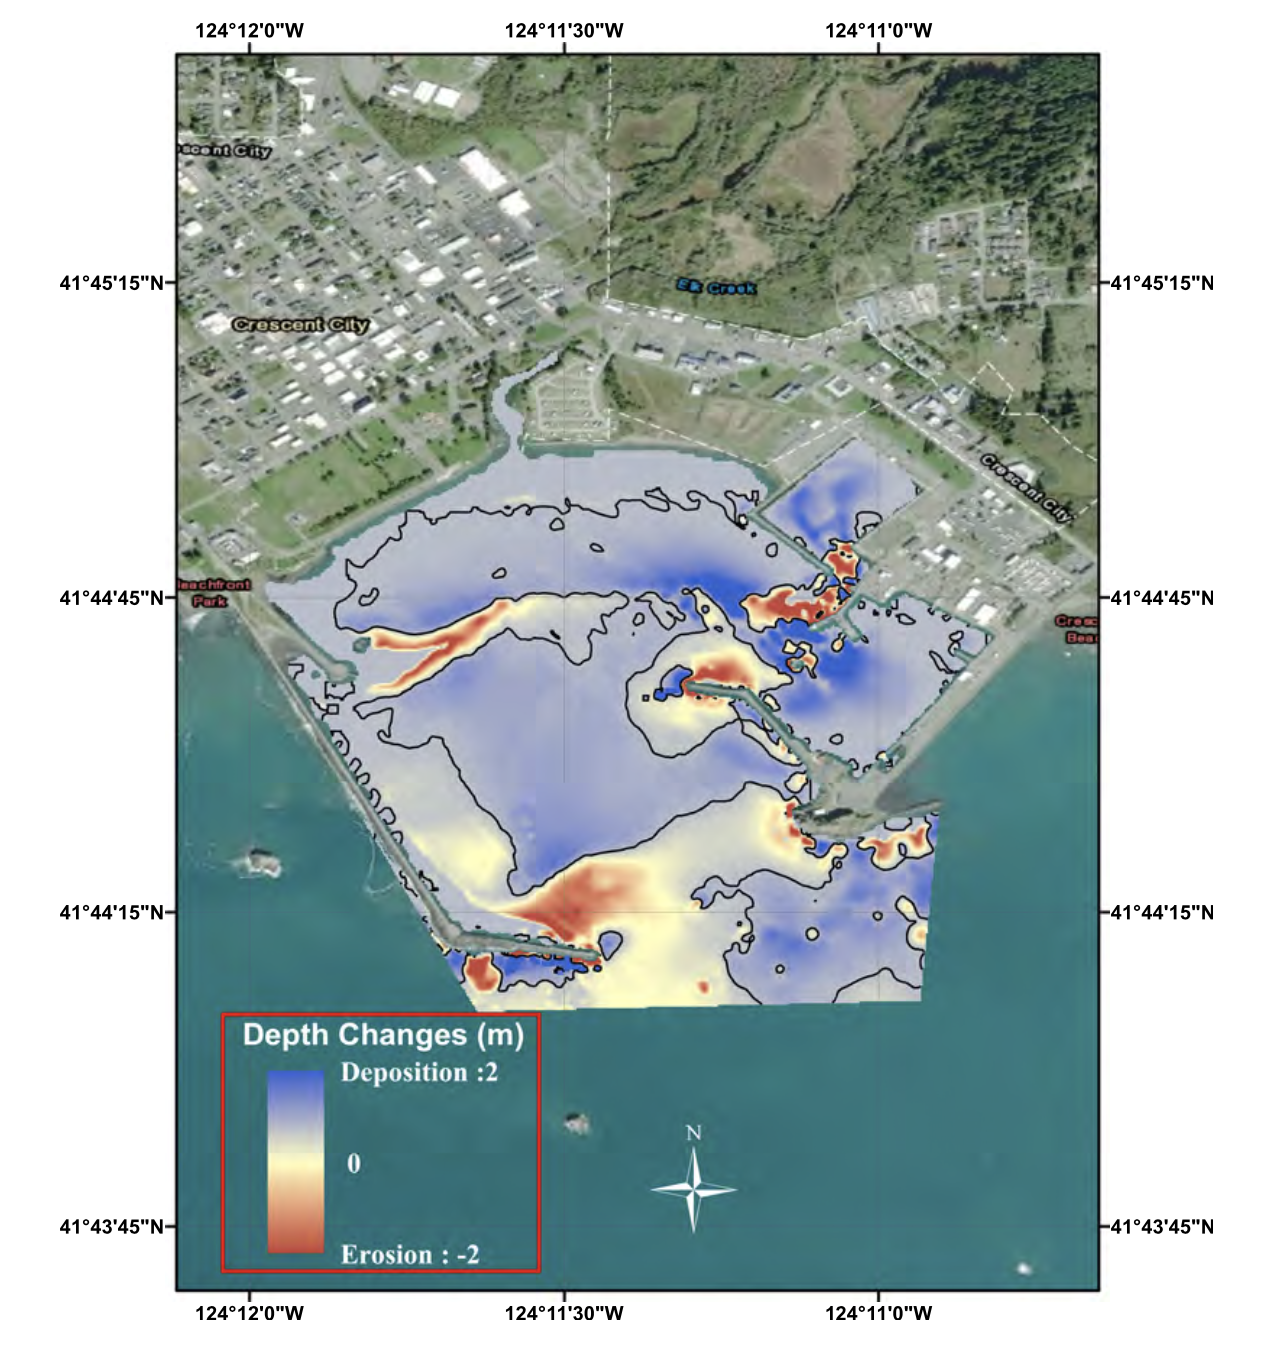
This benchmark problem addresses the modeling of erosional and depositional processes occurring in the boat harbor at Crescent City, CA, which was severely impacted by the Tohoku 2011 tsunami event. An overview of the event and the observed morphology changes resulting from the event may be found in Wilson et al. (2012). The estimate of observed morphology change is based on pre- and post-event surveys conducted on February 21, 2010 and March 30, 2011 by the USACE. The difference of these two surveys is displayed for the main harbor basin in Fig. 1.1, and shows a gently varying pattern of erosion and deposition over the main basin, with the exception of pronounced erosional hotspots near the ends of jetty structures, which are representative of scouring around the structure tips due to localized strong currents. A small-boat basin is located to the north of the main harbor basin (see inset in Fig. 1.1) and is shown at better resolution in Fig. 1.2. The small-boat basin was strongly impacted by deposition around the dock areas, resulting from strong scouring in the constricted entrance to the basin.
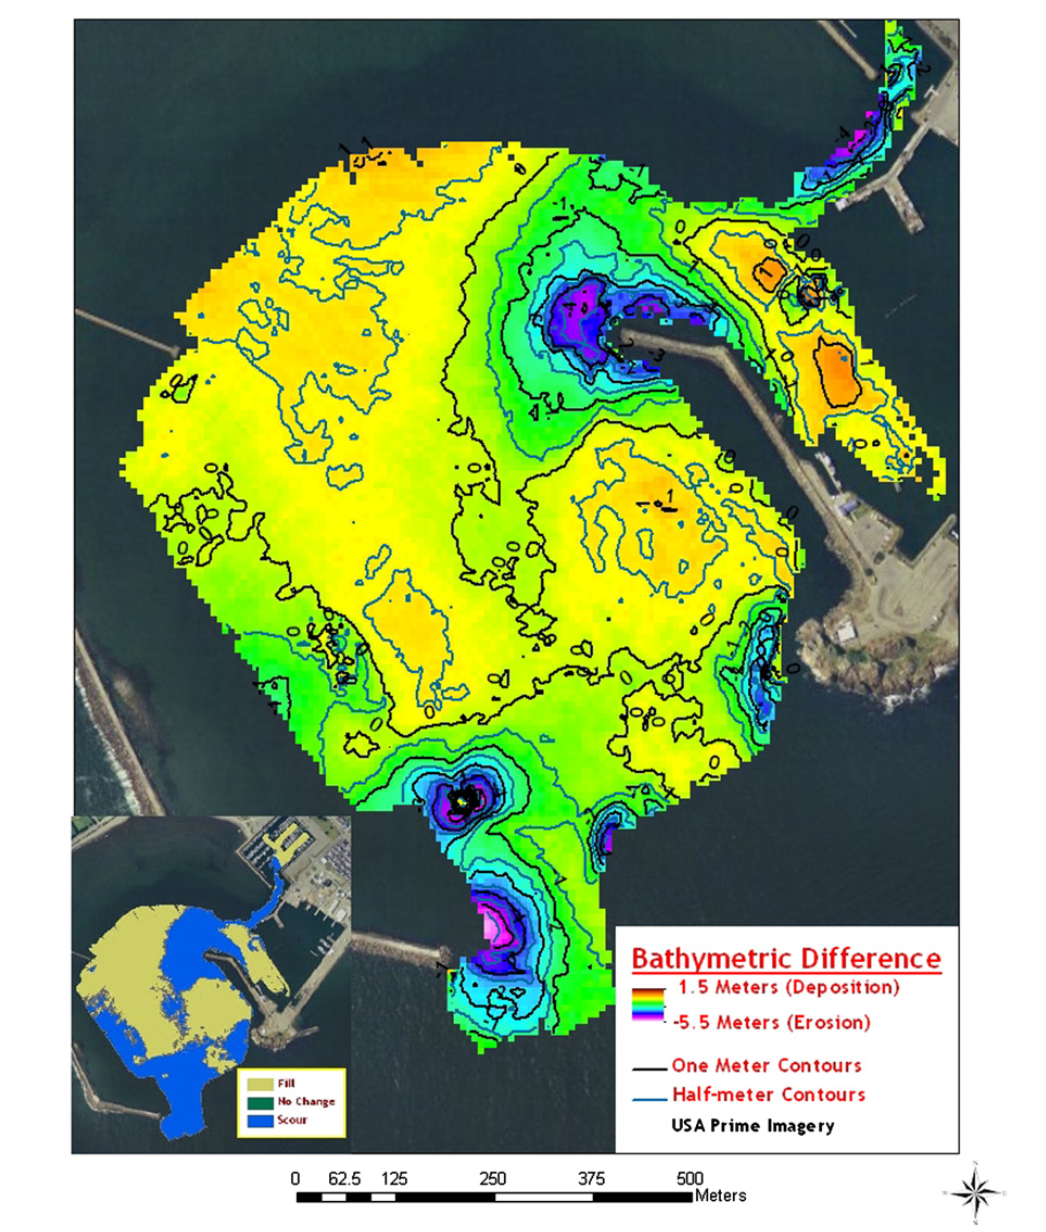
Fig. 1.1: Areas of scour and fill in the outer and middle portion of the Crescent City Harbor determined by differencing multi-beam bathymetry collected by NOAA on March 16-21, 2011 and November 2008. (Wilson et al., 2012, Fig. 4).
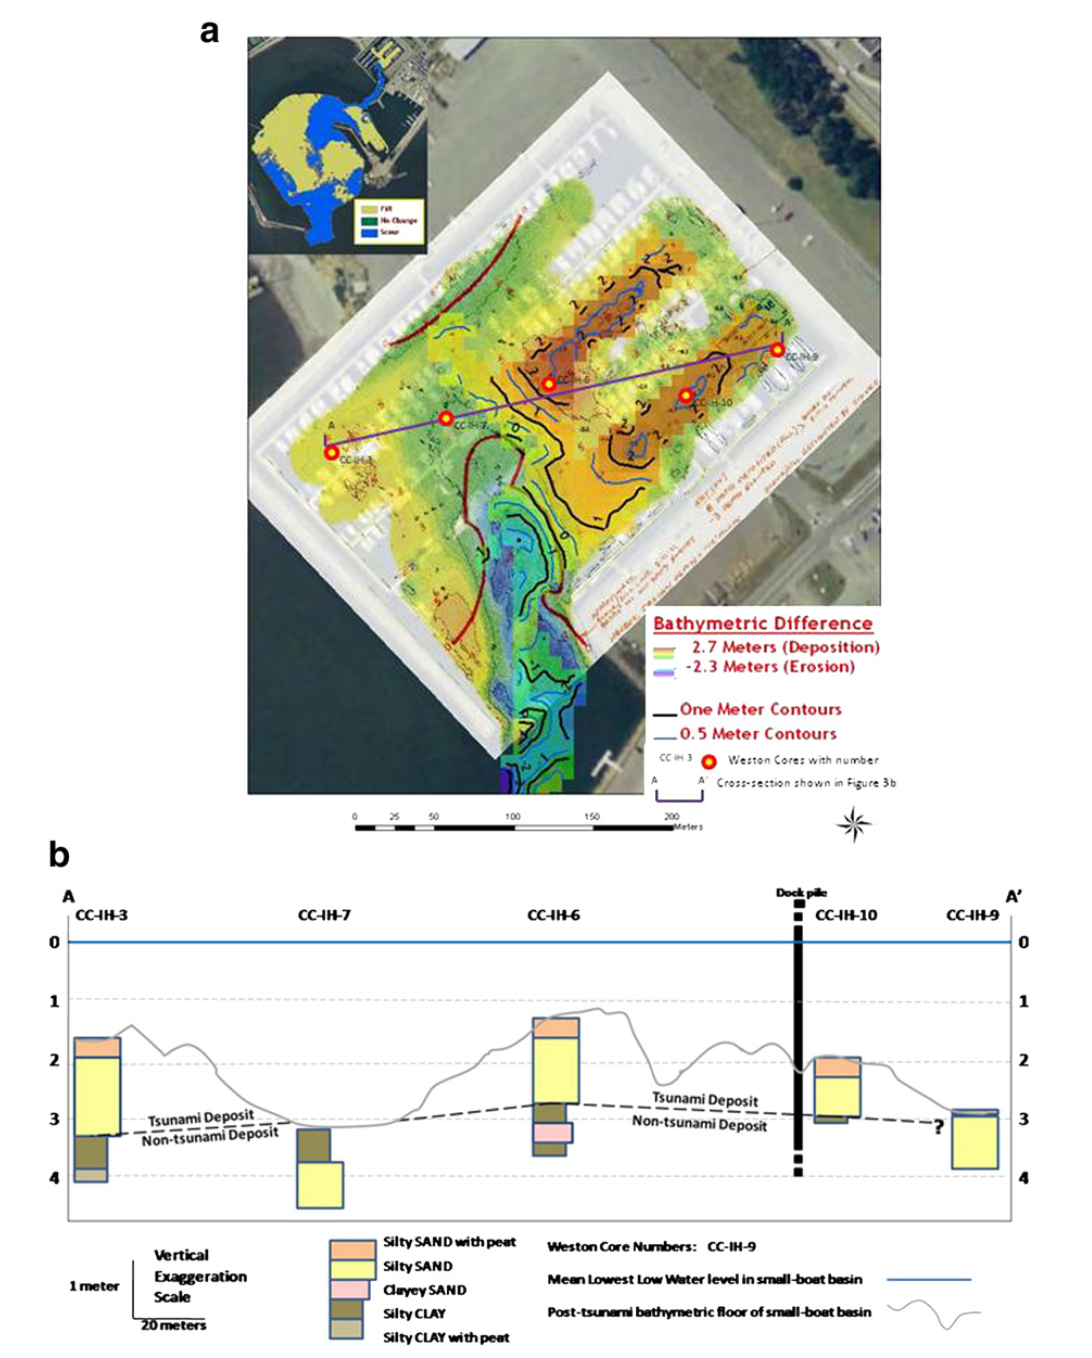
Fig. 1.2: (a) Areas of scour and fill in the Crescent City Harbor Small-boat Basin determined by differencing multi-beam bathymetry collected by NOAA on March 16-21, 2011 and November 2008, superimposed on similar, more extensive raster image provided by Harbormaster. (b) cross section showing the post-tsunami bathymetry, sediment composition, and correlations between tsunami and non-tsunami deposits within the Small-Boat Basin (Wilson et al., 2012, Fig. 3).
The data for specifying the boundary information for Grid 5 has been computed using the Tohoku source described in Grilli et al. (2013), using the sequence of nested grids described by Tehranirad et al. (2021). A comparison of model predictions and observed de-tided surface displacement at DART buoy 46407 during the event is shown in Fig 1.3, based on computations using Tehranirad et al.'s sequence of grids.
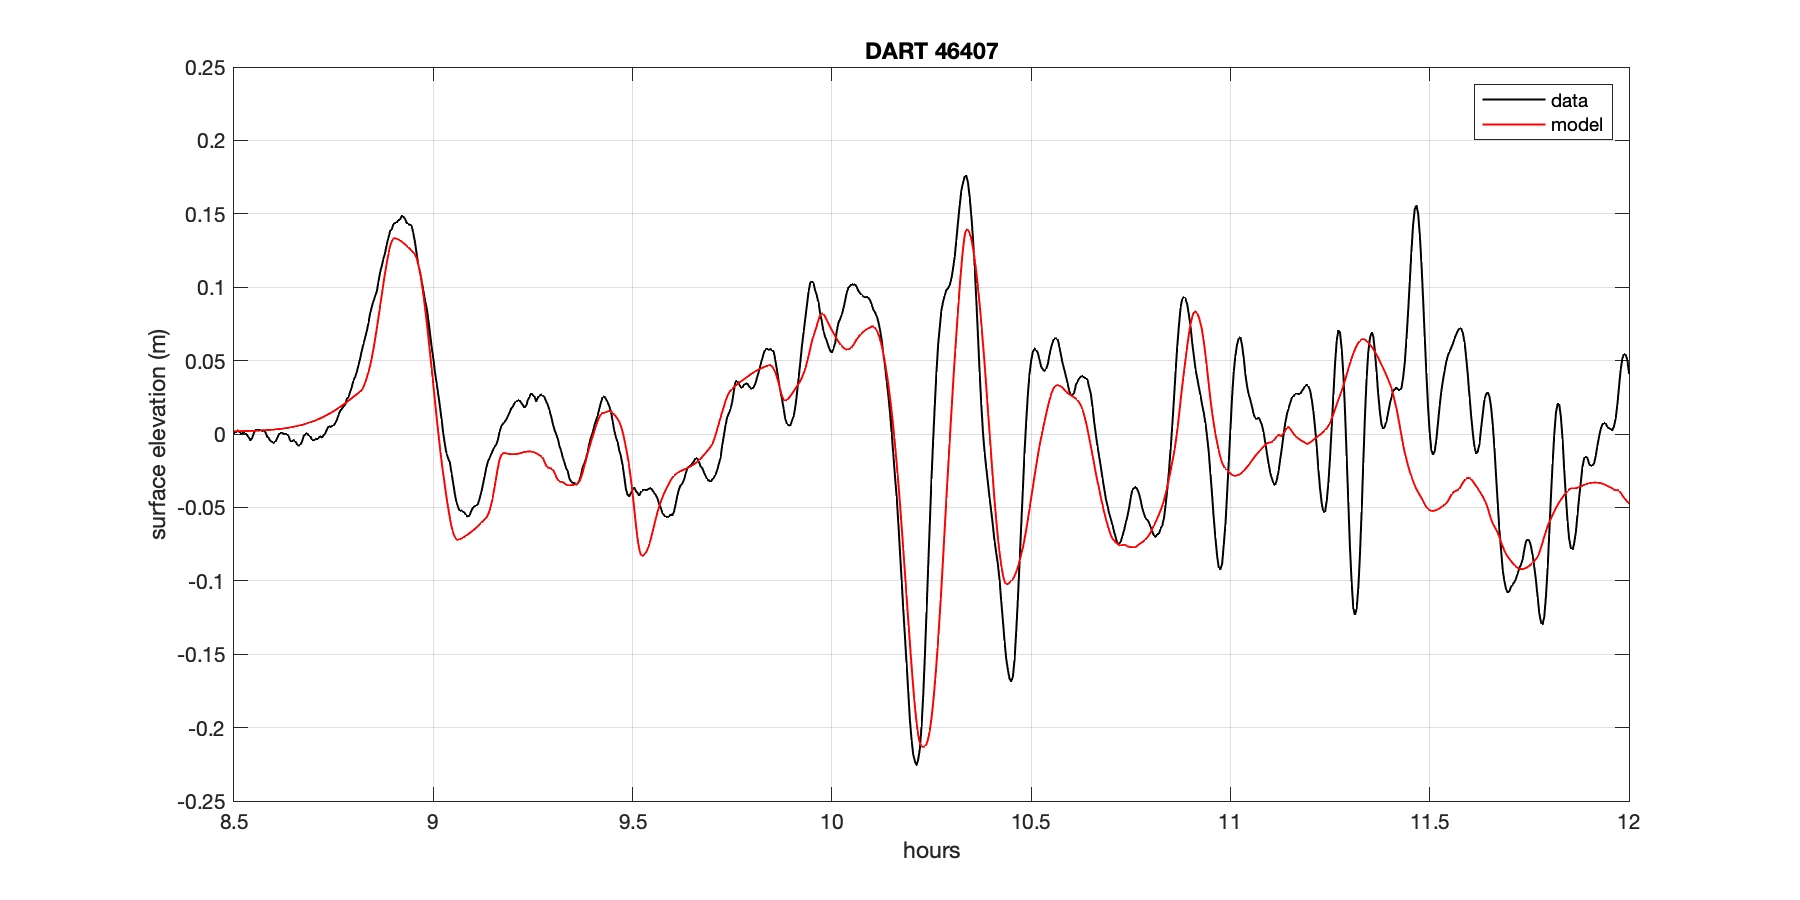
Fig. 1.3: Comparison of observed (black) and modeled (red) surface displacements at DART buoy 46407 during the Tohoku event. Model computations as described in Tehranirad et al. (2021).
Data Provided:
The file crescent_city.zip contains a variety of gridded data described in the readme file. In particular, the folder DEM contains the five levels of nested grids used in the simulations of Yamashita et al. (2022), with grid level 5 corresponding to the region shown in Fig 1.4, for which the time-dependent boundary data for surface elevation and velocities will be provided. The folder also contains maps of erodible/non-erodible surfaces, initial distributions of depths of erodible sediments, and the location of pier structures that are likely to impact the flow. The grid of depth changes resulting from pre- and post-event surveys is contained in the file "dh_crescent_city_0.3sec_NOAA_USACE_501x361.dat".
The time dependent nesting data for the boundary of grid level 5 is also provided in the file crescent_city.zip in the folder "nesting data". The folder contains the data file "Tehranirad_source_every_10s.data", which is the boundary data for surface elevation and velocity at 10 second intervals for the perimeter of grid 5. The file "readme_nesting_data" describes the data file's format and an example for reading the file in fortran.
Benchmark Problem:
The benchmark problem here is to compute a map of the erosion and deposition in Crescent City Harbor, using your own or provided (described above) hydrodynamic inputs from larger scale simulations. The map will be compared to observed data displayed in Figs. 1.1 and 1.2. (Tests to be applied to the model results will be further described as they evolve.)
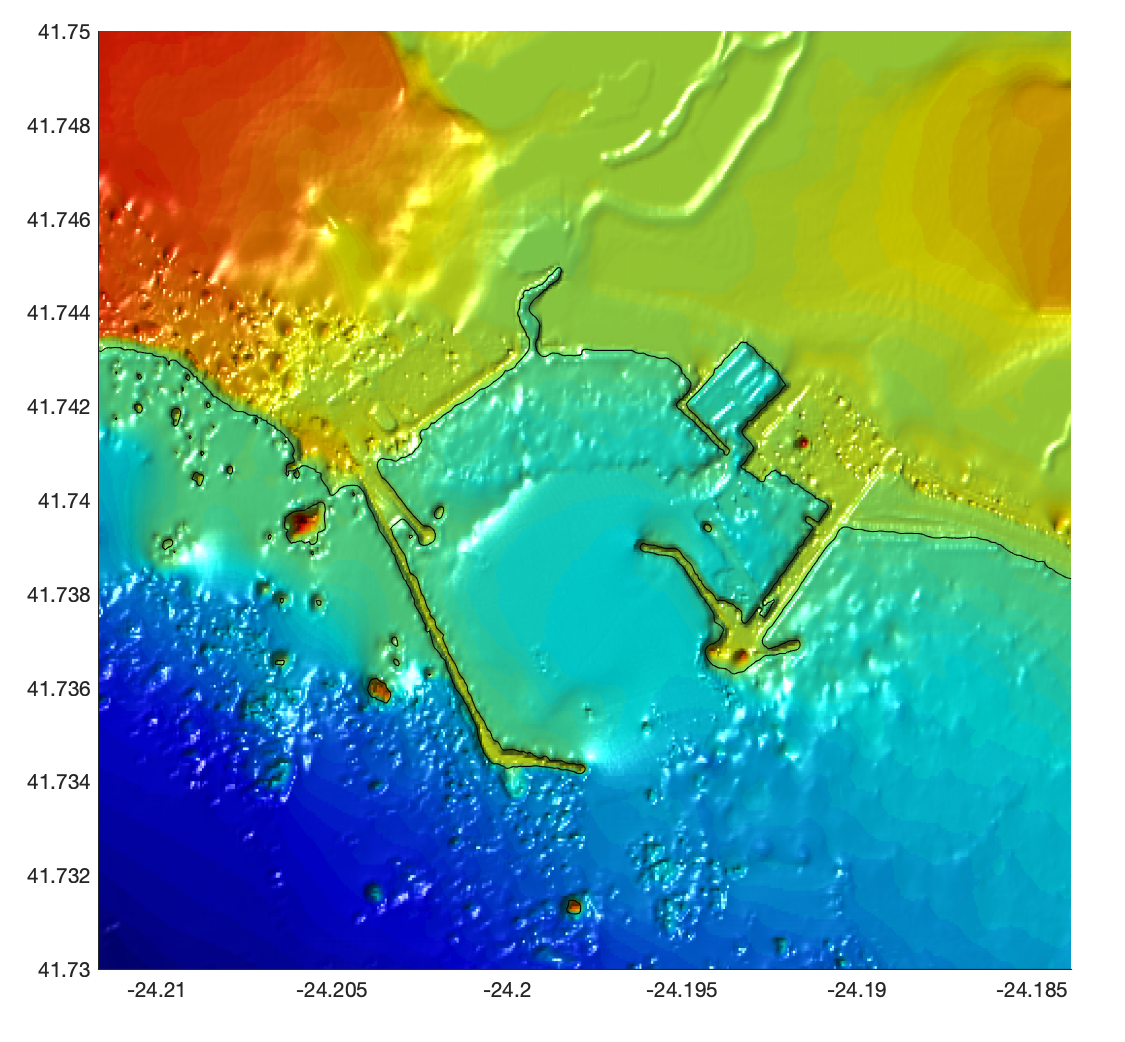
Fig 1.4: Final nested grid coverage for the Benchmark 1, Crescent City Harbor, CA case (Yamashita et al. (2022), grid level 5).