Notes on nesting data provided for Benchmarks 1 and 2.
Benchmarks 1 and 2 are based on the impact of the 2011 Tohoku tsunami on Crescent City Harbor, CA, and Rekuzentakata, Hirota Bay, Japan. Both of these cases have been used as the basis for developing and testing tsunami sediment transport models in recent years. The hydrodynamic input for each case are based on the same co-seismic deformation event. Modelers have used a variety of source configurations for these studies. An examination of published results to date, shows that the slip model of Yamazaki et al (2018) has provided the best representation of the far-field hydrodynamic signature, particularly for the Benchmark 1 problem, as demonstrated by Yamashita et al (2022), figure 13, reproduced here.
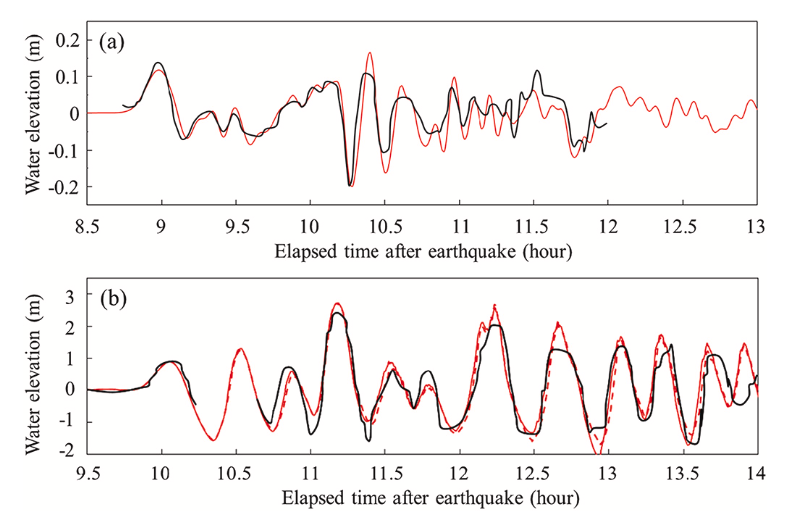
Fig 0.1: Time series of computed and observed water surface elevations for the 2011 Tohoku tsunami. (a) DART 46407. (b) Tide gauge in Crescent City harbor, USA. Black line indicates observations and solid and dashed red lines denote NEOWAVE results with and without the coupled sediment transport model (Yamashita et al (2022), Fig. 13)
It is possible that workshop participants who have performed studies using the Tohoku event could provide the boundary input data for the more regional benchmark studies using there own simulations and choices of source configuration, bathymetric data and grid nesting configurations. However, in order to eliminate this burden as much as possible, we are providing boundary data for a final nesting level for each benchmark, with the data formats described in the sections for each benchmark.
Source configuration:
The implementation of the source is described here . Also provided are a table of the individual subfault properties , along with a Matlab script for plotting the subfault locations . The result of running the script is shown in Fig. 0.2.
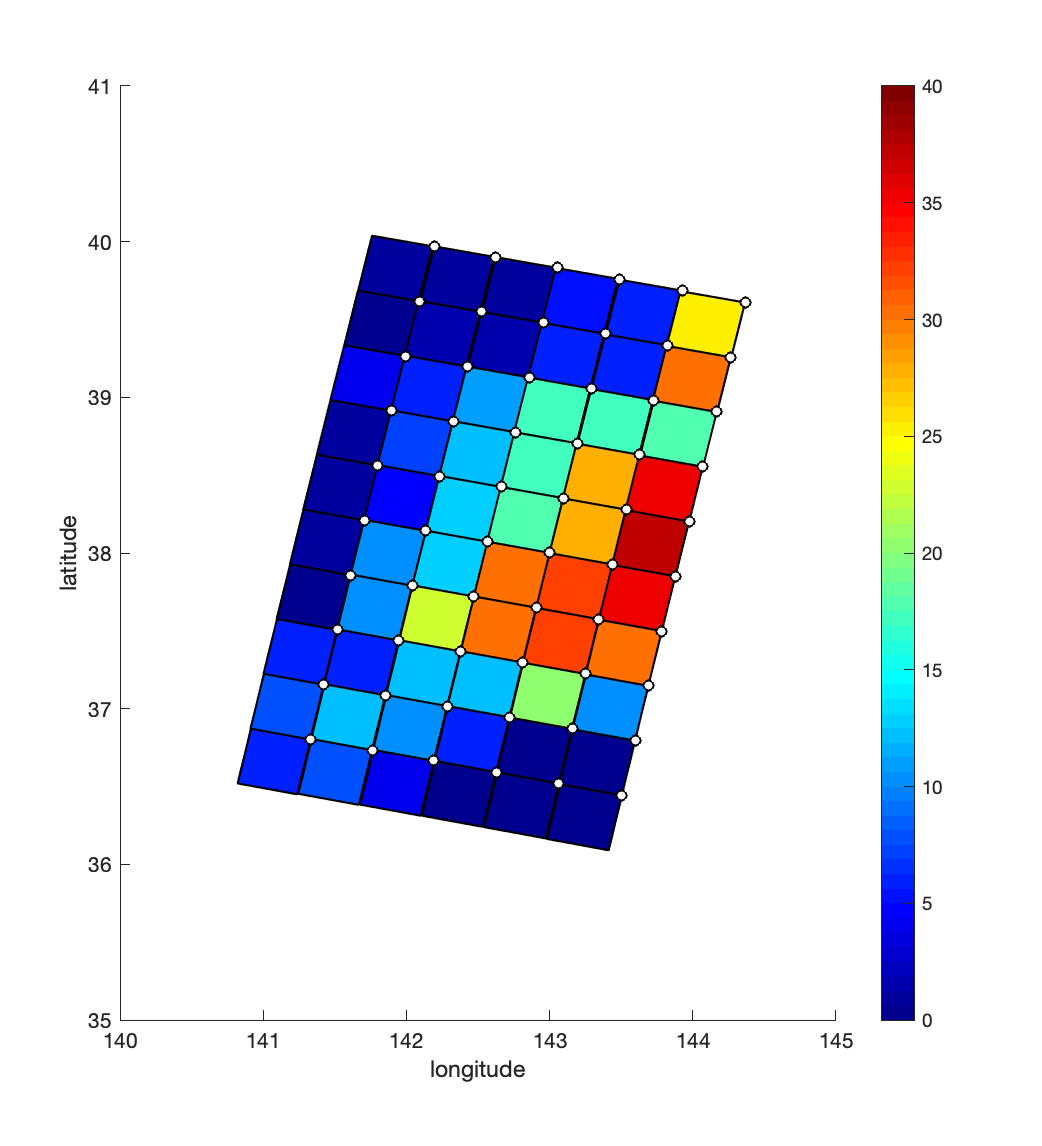
Fig 0.2: Spatial distribution of slip for the Tohoku tsunami event based on the model of Yamazaki et al (2018).
Grids for sediment transport calculations:
Grids for performing a regional scale sediment transport calculations are provided for Benchmarks 1 and 2 and are described further on the page for each benchmark. These grids correspond to the final level of nesting in the simulations described by Yamashita et al (2022), and are shown here for convenience. The calculation of boundary data is carried out using the source configuration described above, implemented as a time-dependent bottom configuration in the 3D nonhydrostatic model NHWAVE (Ma et al, 2012), after which the Boussinesq-type model FUNWAVE-TVD is used in a spherical-coordinate configuration to calculate the ocean basin-scale tsunami propagation (Kirby et al, 2013). Similar calculations have been used to generate nesting data for Crescent City sediment transport calculations by Tehranirad et al (2021). The final Crescent City grid used here covers a slightly large area than used in Tehranirad et al (2021) (MORE DETAIL TO BE ADDED).
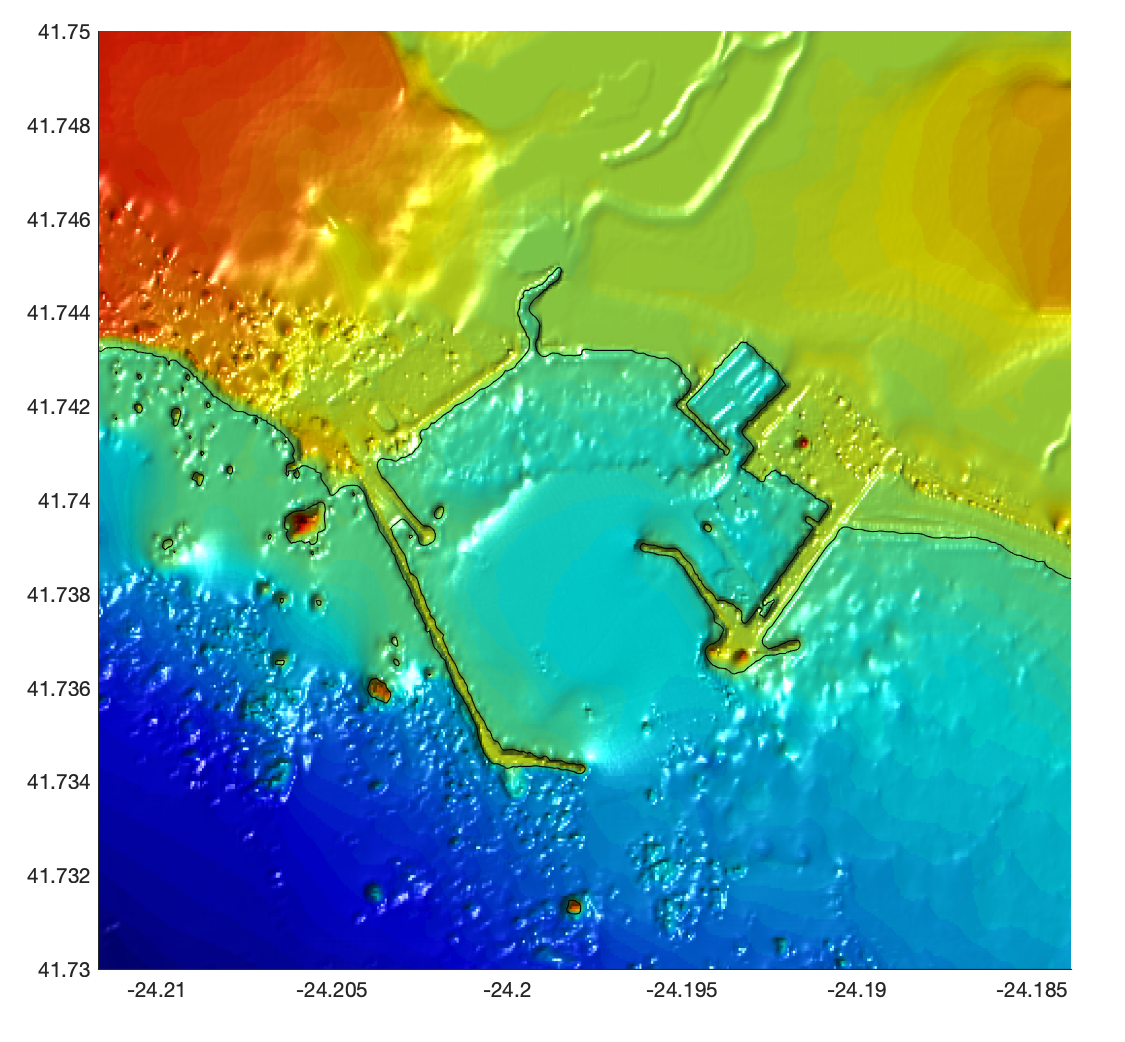
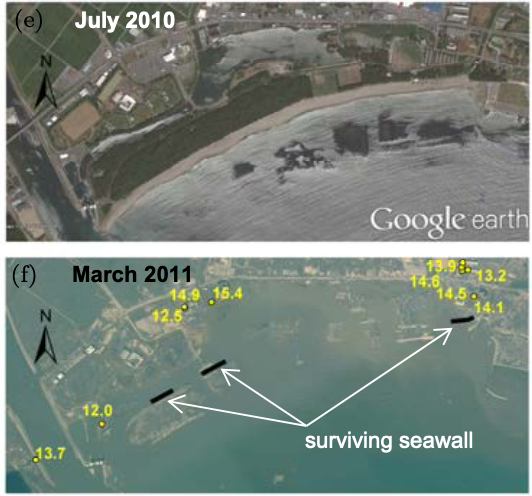
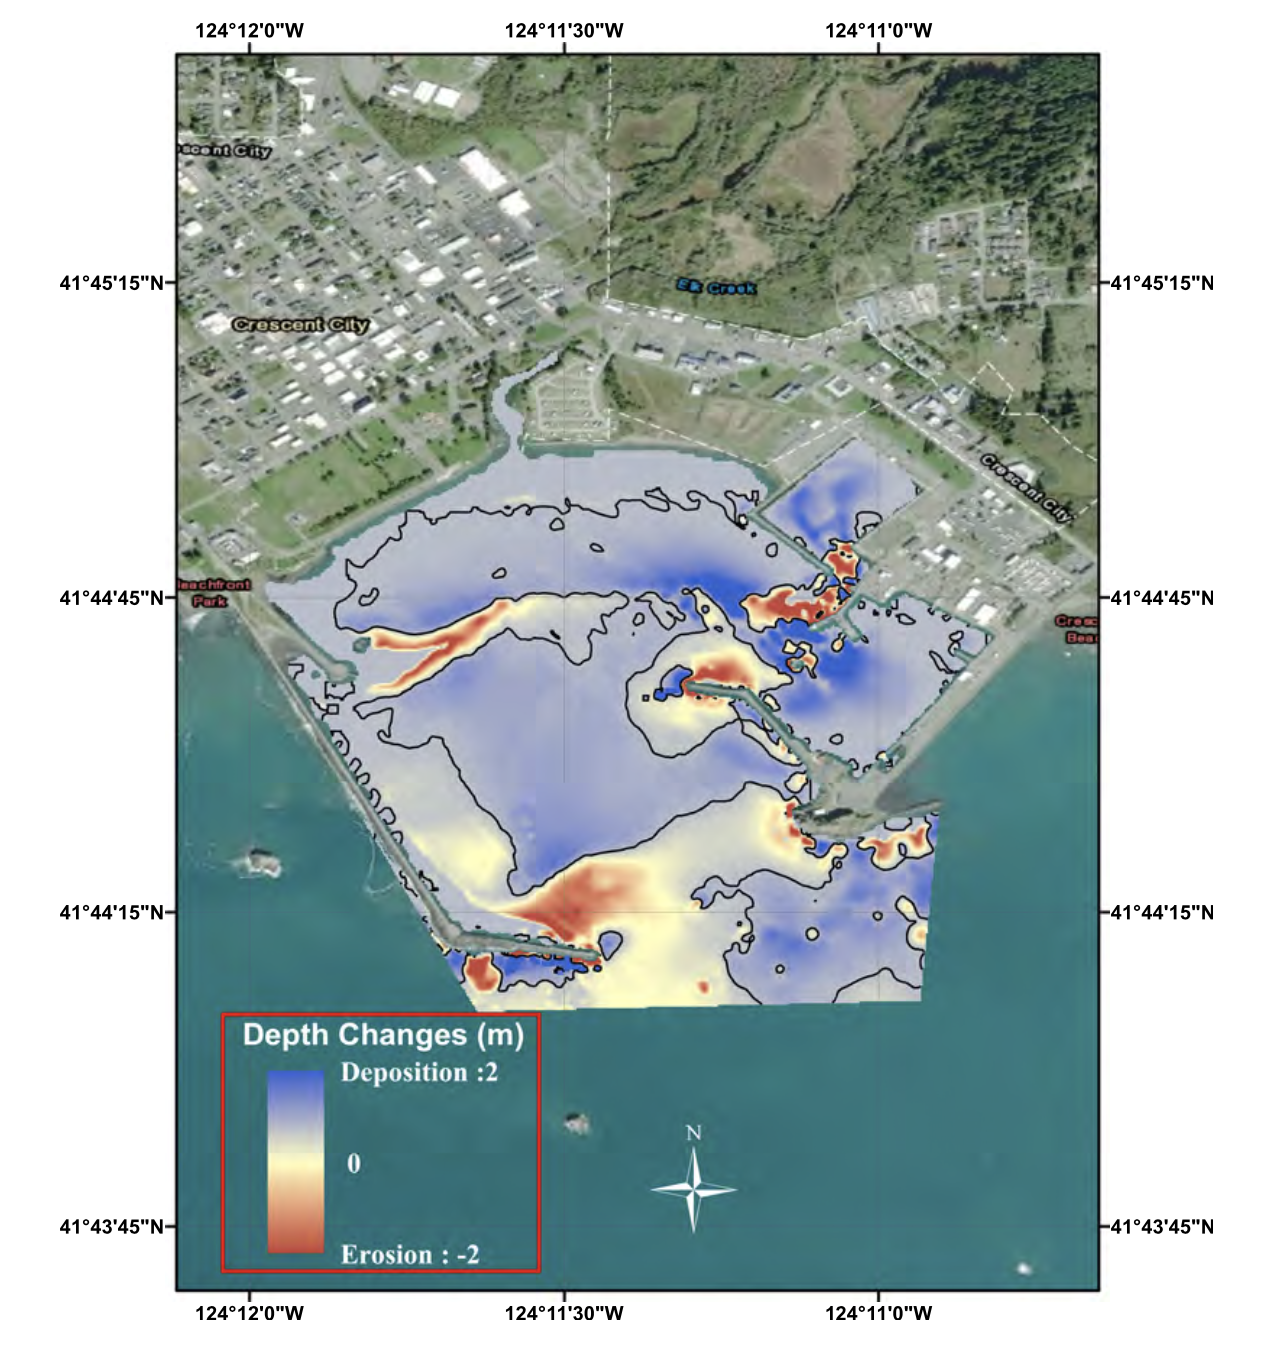
Fig 0.3: Final nested grid coverage for the Benchmark 1, Crescent City Harbor, CA case.
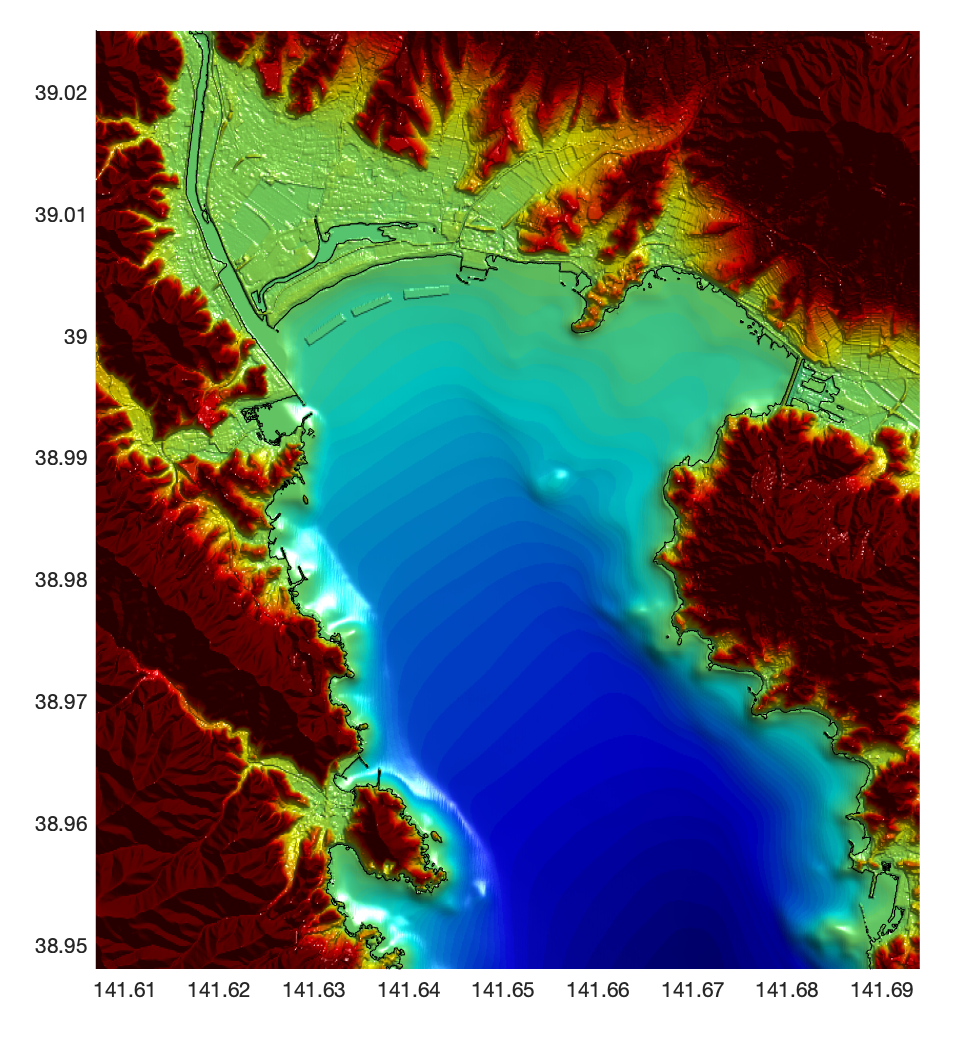
Fig 0.3: Final nested grid coverage for the Benchmark 2, Hirota Bay/Rekuzentakata case.