Technical Report
A technical report The NTHMP Landslide Tsunami Benchmark Workshop, Galveston, January 9-11, 2017 has been developed and describes the motivation for the workshop, the set of benchmark tests collected, methodology for testing model results, an overview of the submitted models and their performance on Benchmark tests 2, 4 and 7.
The benchmarks used for analysis in the report include:
- Benchmark 2: 3D - Submarine solid block slide with elliptic cross sections in two dimensions (Enet and Grilli, 2007)
- Benchmark 4: 2D - Deformable submarine slide (Grilli et al, 2016)
- Benchmark 7: 3D - Field case, Port Valdez, AK 1964 (Nicolsky et al., 2013)
Further information about the full set of proposed tests may be found in the Technical Report or at the "Benchmark Problems" tab above.
Supplemental contributions
Supplemental contributions consist of model documentation supplied by the modelers who submitted results for evaluation, and documentation of invited presentations covering geological background, new experimental results, and additional modeling examples and case studies. Several presentations were not available either as the original powerpoint presentations or as subsequent write-ups. A complete list of presentations is documented in the workshop agenda.
Model documentation
- FBSlide (I. Fine, Institute for Ocean Sciences, Sydney, BC)
- Alaska Landslide Tsunami Model (D. Nicolsky, University of Alaska - Fairbanks)
- GloBouss and BoussClaw (F. Lovholt, G. Pedersen and J. Kim, University of Oslo)
- NLSW, Boussinesq and Mild Slope Equation models (P. Lynett, University of Southern California)
- NHWAVE (Gangfeng Ma (Old Dominion University), Jim Kirby, Fengyan Shi, Cheng Zhang (University of Delaware), Stephan Grilli (University of Rhode Island) ). See also Zhang et al. (2017) for more detail on all seven benchmarks.
- Landslide-HySEA and Multilayer-HySEA (J. Macias, C. Escalante, M. J. Castro, J. M. Gonzalez-Vida and S. Ortega, University of Malaga)
- LS3D and 2LCMFlow (S. Yavari-Ramshe and B. Ataie-Ashtiani, Sharif University)
- TSUNAMI3D (W. Cheng, J. Horrillo and R. C. Sunny, Texas A&M University - Galveston)
- THETIS (S. Abadie and L. Clous, University de Pau & Pays Adour)
Invited talks: The geological framework
- D. Tappin (British Geological Society), The geology of submarine landslide tsunamis
- J. Chaytor (U. S. Geological Survey)Characterizing East and Gulf Coast landslide sources (talk not available)
- H. Lee (U. S. Geological Survey), Geotechnical and geologic constraints on tsunamigenic submarine landslides
Invited talks: Laboratory studies
- G. Bellotti (Univ. Roma Tres), Physical modelling of landslide generated tsunamis around a conical island: Recent developments.
- O. Kimmoun^1, S. Viroulet^2 and G. Dupont^1 (^1 Ecole Centrale Marseille, ^2 Institut de Physique du Globe), Small scale experiments on subaerial and submarine landslides.
- Hermann Fritz (Georgia Institute of Technology), Physical Modeling of Tsunamis generated by 2D and 3D granular Landslides in various Scenarios from Fjords to conical Islands. (talk not available)
Additional invited and contributed talks
- P. Liu (Cornell University and National University of Singapore) Review of previous benchmarking workshops
- P. Lynett (Univ. of Southern California), The Tsunami Generated by the October 17, 2015 Taan Fjord Landslide
- P. Liu (Cornell University and National University of Singapore), Brief intro to SPH modeling of slides
Provided benchmark data
Please see the individual Benchmark descriptions for links to the provided benchmark data files. Time series for laboratory observations are alos included in the formatted model results (next section) as Model 0.
Formatted model results
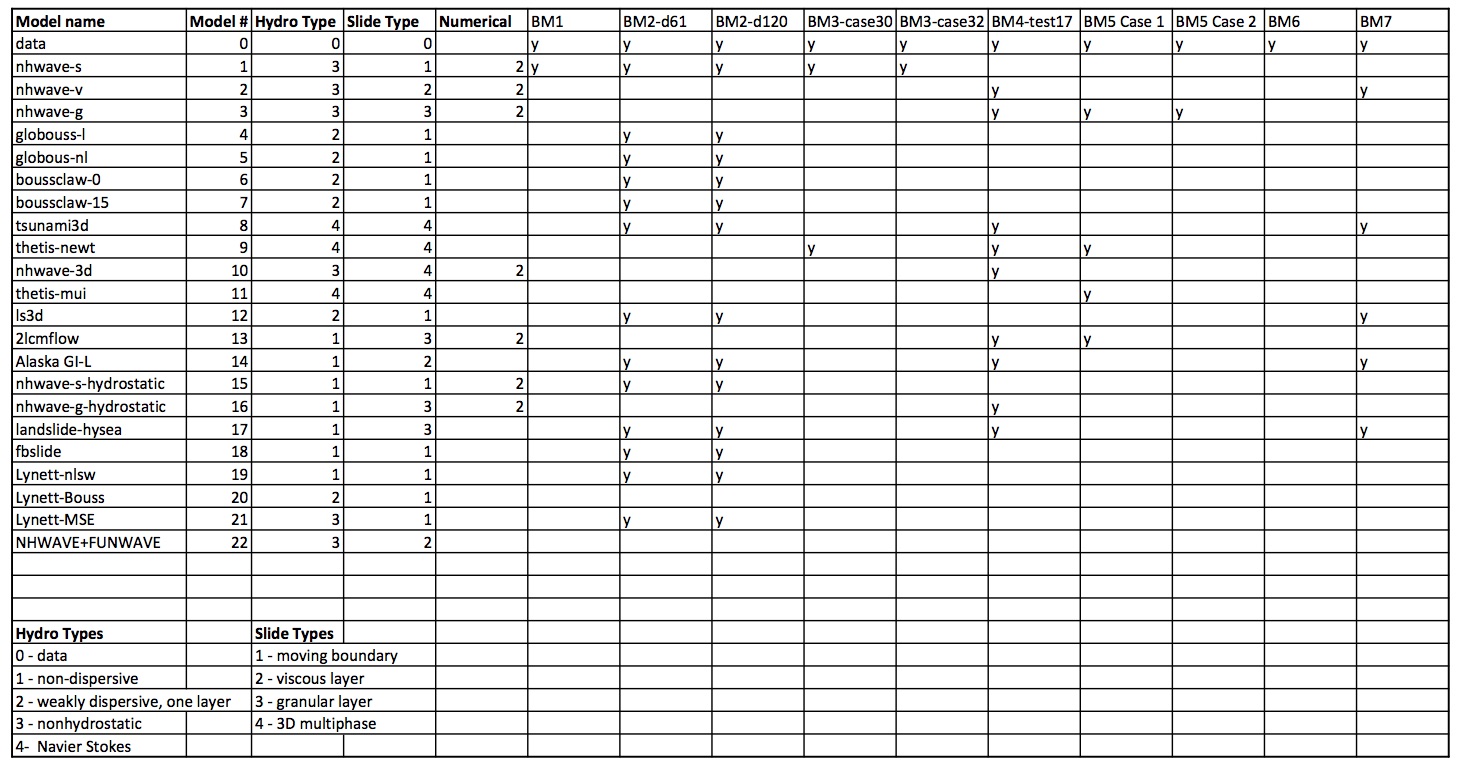
Formatted results may be found in the zip file formatted_results.zip. This file has a size of 33 MB and so may take a few minutes to download. Files in the unzipped folder are Matlab .mat files, each containing a single data array with dimension (N by 5). For Benchmarks 2 and 4, the array columns contain time (s) and surface displacements at gauges 1 -4 (mm). For Benchmark 7, the files are in a similar format, with columns 2-5 displaying elevations at the Navigation Light, Old Valdez Hotel, Point 37 and Point 38, all in meters (m). Each file name follows the following convention:
bmX_mY_NOTE.mat
where X denotes the benchmark number (2, 4 or 7) and Y denotes the model number as indicated in the following table. Possible NOTES are "d061" or "d120" for the two depths of submergence in Benchmark 2, or "case1" for Benchmark 2, which indicates the data set Test17 and was the only case used. For each case in Benchmarks 2 and 4, model number X=0 indicates the observed data, reformatted into the same common format. (Observed time series data does not exist for Benchmark 7). Finally, we note that the folder contains submitted results for several of the models for Benchmarks 3 and 5. These results are provided for inspection but were not analyzed or otherwise represented in the final technical report.
Results for the statistical measures defined in Section 4 of the technical report may be found in the zipped folder stats.zip. This folder contains files error_data.mat, which provides the RMS error data and is used by programs statistical_results_1.m and statistical_results_2.m, and error_heights.mat, which contains the results for maximum and minimum elevations, maximum total excursions, and total variance, used by program statistical_results_3.m
Programs used in data analysis
Matlab scripts used to plot and analyze model results are contained in the zipped folder programs.zip