Benchmark Problem #6: Three-dimensional subaerial granular slide
This benchmark problem is based on the 3D laboratory experiments of Mohammed and Fritz (2012)
1. Experimental Setup
The landslide tsunami experiments were conducted in the tsunami wave basin at Oregon State University in Corvallis. The landslides are deployed off a plane slope built on one end of the wave basin as shown in Figure 1. The landslide material is deployed in a box measuring ![]() , with a volume of
, with a volume of ![]() and weight of approximately
and weight of approximately ![]() .
.
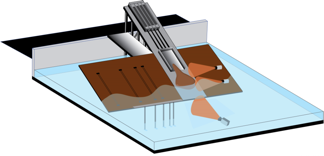
Figure 1. Landslide Tsunami Generator Setup
The plane slope has a slope
angle of ![]() corresponding to a slope of 1 vertical to
2 horizontal. Two coordinate systems are defined to characterize the slide
motion and wave propagation independently. Both the coordinate systems can be
unified through the location of the shoreline, which is dependent on the water
depth. The wave gauge locations in the basin with reference to the toe of the
slope is shown in Figure 2.
corresponding to a slope of 1 vertical to
2 horizontal. Two coordinate systems are defined to characterize the slide
motion and wave propagation independently. Both the coordinate systems can be
unified through the location of the shoreline, which is dependent on the water
depth. The wave gauge locations in the basin with reference to the toe of the
slope is shown in Figure 2.
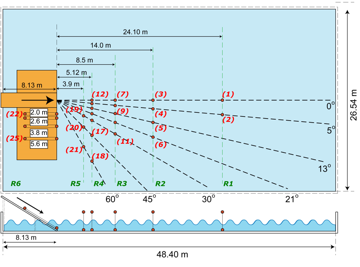
Figure 2. Wave gauge location in the wave basin relative to the wave basin.
The slope coordinate system ![]() and the wave gauge coordinate system
and the wave gauge coordinate system ![]() is shown in Figure 3 for a reference water depth of
is shown in Figure 3 for a reference water depth of ![]() . The
locations of the wave gauges are with reference to the toe of the slope shown
in Figure 2.
The toe and the shoreline can be related to each other knowing the slope angle
of the hill slope as shown in Figure
3.
Similarly, the shoreline location with reference to the slope coordinate system
can be related to the water depth as shown in Figure 3.
. The
locations of the wave gauges are with reference to the toe of the slope shown
in Figure 2.
The toe and the shoreline can be related to each other knowing the slope angle
of the hill slope as shown in Figure
3.
Similarly, the shoreline location with reference to the slope coordinate system
can be related to the water depth as shown in Figure 3.
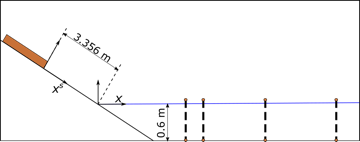
Figure 3.
Two coordinate systems ![]() and
and ![]() shown for the slide and wave
measurements. The
shown for the slide and wave
measurements. The ![]() -direction
is considered to be perpendicular outside the image.
-direction
is considered to be perpendicular outside the image.
The wave gauges numbered by
indices 1-25 in the wave basin are located at ![]() locations in the tsunami wave basin with reference to the hill slope toe and the wave
basin coordinate system as shown in Table 1
locations in the tsunami wave basin with reference to the hill slope toe and the wave
basin coordinate system as shown in Table 1
Table 1. Wave gauge location with reference to the toe.
|
WG# |
|
|
|
1 |
24.1 |
0 |
|
2 |
24.1 |
2.108 |
|
3 |
14.0 |
0.0 |
|
4 |
14.0 |
1.225 |
|
5 |
14.0 |
3.232 |
|
6 |
14.0 |
5.374 |
|
7 |
8.5 |
0.0 |
|
8 |
8.5 |
0.744 |
|
9 |
8.5 |
1.962 |
|
10 |
8.5 |
3.236 |
|
11 |
8.5 |
4.907 |
|
12 |
5.12 |
0.0 |
|
13 |
5.12 |
0.448 |
|
14 |
5.12 |
1.182 |
|
15 |
5.12 |
1.965 |
|
16 |
5.12 |
2.956 |
|
17 |
5.12 |
5.12 |
|
18 |
5.12 |
8.868 |
|
19 |
3.9 |
2.252 |
|
20 |
3.9 |
3.9 |
|
21 |
3.9 |
6.755 |
|
Runup Wave Gauges |
||
|
22 |
0 |
2.0 |
|
23 |
0 |
2.6 |
|
24 |
0 |
3.8 |
|
25 |
0 |
5.6 |
The location of the wave gauges with reference to the shoreline varies with the water depth. Considering the slope planar hill (1:2) the following increments shown in Table 2 are added to the “X” coordinate system for the water depths.
Table 2. Increment added to the wave gauge map for appropriate water depth.
|
|
|
|
0.3 |
0.6 |
|
0.6 |
1.2 |
|
1.2 |
2.4 |
A total of twelve experimental
trials are presented along with this document. It should be noted that the
slide deposits information are not available for a
water depth of ![]() . The PX case corresponds to a pressure in the
pneumatic pistons of the landslide tsunami generator
. The PX case corresponds to a pressure in the
pneumatic pistons of the landslide tsunami generator ![]() with
with ![]() and
and
![]() .
For each water depth and P combination, the location of the slide impact with
the shoreline in the slope coordinate system changes. The corresponding
shoreline location in the slope coordinate system at impact for all the cases
is shown in Table 3.
The corresponding slide front velocity can be extracted from the data on
slide front velocity as a function of distance
.
For each water depth and P combination, the location of the slide impact with
the shoreline in the slope coordinate system changes. The corresponding
shoreline location in the slope coordinate system at impact for all the cases
is shown in Table 3.
The corresponding slide front velocity can be extracted from the data on
slide front velocity as a function of distance ![]() as shown in Figure 4. The time of impact of the slide front
with the shoreline is also shown in Table 3. Since the time coordinate of the wave
gauges are initialized to the slide motion initiation, the
as shown in Figure 4. The time of impact of the slide front
with the shoreline is also shown in Table 3. Since the time coordinate of the wave
gauges are initialized to the slide motion initiation, the ![]() time allows to fix the moment of slide
impact with the water body.
time allows to fix the moment of slide
impact with the water body.
Table 3. LTG Experimental Cases
|
|
|
|
|
|
P145 |
30 |
2.663 |
0.44 |
|
60 |
3.356 |
0.37 |
|
|
120 |
2.014 |
0.3 |
|
|
|
|
||
|
P116 |
30 |
2.663 |
0.47 |
|
60 |
3.356 |
0.39 |
|
|
120 |
2.014 |
0.33 |
|
|
|
|
||
|
P87 |
30 |
2.663 |
0.49 |
|
60 |
3.356 |
0.4 |
|
|
120 |
2.014 |
0.37 |
|
|
|
|
||
|
P58 |
30 |
2.663 |
0.52 |
|
60 |
3.356 |
0.44 |
|
|
120 |
2.014 |
0.4 |
2. Summary of Coordinate Systems
Wave Gauges
Spatial: Distances of the wave
gauges are with reference to the toe of the hill slope. Incremental distances, ![]() shown in Table 2, are added to the
“X” coordinate system for the appropriate water depth to obtain the wave gauge
locations with reference to the shoreline.
shown in Table 2, are added to the
“X” coordinate system for the appropriate water depth to obtain the wave gauge
locations with reference to the shoreline.
Temporal: The time coordinate in the wave gauge history is with the reference to the initiation of the slide motion. In order to adjust the time coordinate to the moment of slide impact, the time of impact is specified in Table 3.
Slide Velocity, Slide
Thickness and Slide Width
Spatial: The slide velocity, thickness and slide width are with reference to the slope coordinate system. In this system, the origin is at the initial location of the slide box along the slide center. The location of impact with the shoreline changes based on the slide location, motion and case as shown in Table 3.
Temporal: The time history of the
slide thickness is with reference to the moment of impact of the slide front
with the shoreline location. ![]() correspond to the moment of the slide
impact with the shoreline.
correspond to the moment of the slide
impact with the shoreline.
Slide Deposit
Spatial: The slide deposit
data is with reference to the slope toe and the wave basin bottom. The location
![]() correspond to the location of the toe
while
correspond to the location of the toe
while ![]() correspond to the bottom of the wave
basin and the hill slope.
correspond to the bottom of the wave
basin and the hill slope.
3. Data Files
All data files referred to below my be found in a zip file LTG_Experiment_Data.zip. The data is stored as Matlab .mat files.
Wave Gauges
File Name: “wg_h_30.mat”, “wg_h_60.mat”, “wg_h_120.mat”
File Description: Time history of water surface elevation at an array of wave gauges in the wave basin.
File Variables: “wg”
Variable Description: The wave gauge data is in [cm] units. The wave gauge data are with reference to the wave basin [spatial] and slide initiation [temporal]. Wave gauges 22-25 are measured along the slope since the wave gauges are inclined along the slope.
Variable Dimension:
![]()
Dimension
Values:
|
|
|
|
|
|
LTG cases corresponding to the 4 P cases shown in Table 3 |
4 |
|
|
Time Array with |
5000 |
|
|
Index of wave gauges as shown in Figure 2. |
25 |
The ![]() locations of the wave gauges relative to
the toe of the slope in the wave basin is shown in Table 1. The actual distances of the wave gauges
locations of the wave gauges relative to
the toe of the slope in the wave basin is shown in Table 1. The actual distances of the wave gauges
![]() from the shoreline can be calculated
based on the water depth and hence the shoreline location from the toe. For ex,
for a water depth of 60cm, the shoreline is located at 1.2m from the toe.
Hence, adding 1.2m to
from the shoreline can be calculated
based on the water depth and hence the shoreline location from the toe. For ex,
for a water depth of 60cm, the shoreline is located at 1.2m from the toe.
Hence, adding 1.2m to ![]() in Table 1 gives the actual locations of the offshore
wave gauges.
in Table 1 gives the actual locations of the offshore
wave gauges.
Slide Velocity
File Name: “slide_velocity.mat”
File Description: Evolution of slide front velocity with slide front location along the slope in the slope coordinate syste,
File Variables: “v58”,”v58_h”,”v87”,”v87_h”,”v116”,”v116_h”,”v145”,”v145_h”
Variable Description: The velocity data is presented as slide velocity [m/s] versus the slide front [m]. The slide velocity is presented in the slope following coordinate system [spatial]. There is no time reference here. The velocity of the LTG slide box and the released granular landslide is included in this data.
Variable Dimension:
![]()
Dimension
Values:
|
|
|
|
|
|
Rows indicate 1: slide front location 2: slide front velocity |
2 |
|
|
# points in the evolution data |
Variable |
“vXXX” contains the slide front velocity along the slide front location for the case corresponding to “XXX = P145,P116,P87,P58”. “vXXX” contains the velocity information corresponding to slide volume of 0.756 m3. “vXXX_h” contains the velocity information corresponding to slide volume of 0.378 m3. The information in the variables vXXX and vXXX_h is shown in Figure 4.
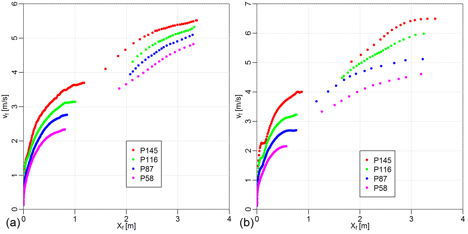
Figure 4. Slide front velocity along the slope with the slide front location.
Slide Thickness
File Name: “Slide_Thick_F.mat”
File Description:
Maximum slide thickness along the slide center along the slide propagation on
the slope for slide volume of 0.756![]() .
.
File Variables: “XFM_P145”,”YFM_P145”, “XFM_P116”,”YFM_P116”, “XFM_P87”,”YFM_P87”, “XFM_P58”,”YFM_P58”
Variables Description:”X” represents the location on the slope [m] and “Y” represents the maximum slide thickness at the “X” location [m]. The “X” is in the slope coordinate system [spatial]. There is no time reference.
File Name: “Slide_Thick_h.mat”
File Description:
Maximum slide thickness along the slide center along the slide propagation on
the slope for slide volume of 0.378![]() .
.
File Variables: “XHM_P145”,”YHM_P145”, “XHM_P116”,”YHM_P116”, “XHM_P87”,”YHM_P87”, “XHM_P58”,”YHM_P58”
Variables Description:”X” represents the location on the slope [m] and “Y” represents the maximum slide thickness [m] at the “X” location. The “X” is in the slope coordinate system [spatial]. There is no time reference.
The maximum slide thickness along the slide propagation on the slope in the slope following coordinate is shown in Figure 5.
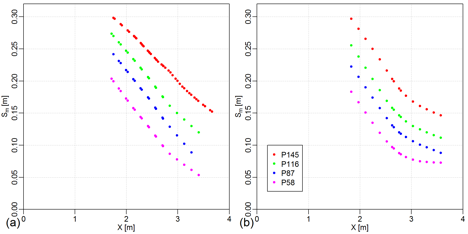
Figure 5.
Maximum slide thickness along the slide slope location for slide volumes of ![]() and
and ![]() .
.
File Name: “Thick_PX_FM.mat” [ 4 files with varying values of X]
File Description:
Time history of slide thickness along the slide center for the 4 cases
corresponding to “X=P145, P116, P87, P58” for slide volume of 0.786 ![]() .
.
File Variables: “x”,”t”,”S”
Variables Description:
“x” : slide propagation along the slope [m]
“t” : time of measurement adjusted to time of impact (t=0) [s]
“S” : slide thickness with dimensions ![]() (i.e length of “x” times length of “t”)[m]
(i.e length of “x” times length of “t”)[m]
The “x” coordinate is in the slope coordinate
system [spatial]. The time is with reference to the moment of impact (![]() is the moment of slide impact with the
shoreline) [temporal]
is the moment of slide impact with the
shoreline) [temporal]
File Name: “Thick_PX_HM.mat” [ 4 files with varying values of X]
File Description:
Time history of slide thickness along the slide center for the 4 cases
corresponding to “X=P145, P116, P87, P58” for slide volume of 0.378![]() .
.
File Variables: “x”,”t”,”S”
Variables Description:
“x” : slide propagation along the slope [m]
“t” : time of measurement adjusted to time of impact (t=0) [s]
“S” : slide thickness with dimensions ![]() (i.e length of “x” times length of “t”)
[m]
(i.e length of “x” times length of “t”)
[m]
The “x” coordinate is in the slope
coordinate system [spatial]. The time is with reference to the moment of impact
(![]() is the moment of slide impact with the
shoreline) [temporal]
is the moment of slide impact with the
shoreline) [temporal]
Slide Width
File Name: “Slide_Width.mat” [ 1 file]
File Description: Edge of maximum slide spread along the slope in the lateral direction. The maximum spread is the same for all the “P” cases and volumes.
File Variables: “X”,”Y”
Variables Description:
“X” : slide propagation along the slope in slope coordinate system [m]
“Y” : Lateral extent of the slide on the slope [m]
The slide motion is with reference to the slope coordinate system [spatial].
The slide width in the file is shown in Figure 6.
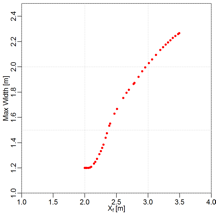
Figure 6. Extent of the maximum slide spread on the slope in the lateral direction
Underwater Slide
Deposit
File Name: “Deps_PX_h60_FM.mat” [ 4 files with varying values of X]
File Description:
Measured underwater slide deposit for the 4 cases corresponding to “X=P145,
P116, P87, P58” for slide volume of ![]() at a water depth of
at a water depth of ![]()
File Variables: “X”,”Y”,”Z”
Variables Description:
“X” : horizontal coordinate with reference to the toe [0 value is the toe of the slope] [m]
“Y” : lateral coordinate along the slope [0 value is the center of the slide][m]
“Z” : two-dimensional array with values of the slide deposits above the basin and slope bottom[m]
The data is with reference to the toe of the slope [spatial]. There is no temporal reference.
File Name: “Deps_PX_h120_FM.mat” [ 4 files with varying values of X]
File Description:
Measured underwater slide deposit for the 4 cases corresponding to “X=P145,
P116, P87, P58” for slide volume of ![]() at
a water depth of
at
a water depth of ![]() .
.
File Variables: “X”,”Y”,”Z”
Variables Description:
“X” : horizontal coordinate with reference to the toe [0 value is the toe of the slope] [m]
“Y” : lateral coordinate along the slope [0 value is the center of the slide] [m]
“Z” : two-dimensional array with values of the slide deposits above the basin and slope bottom [m]
The data is with reference to the toe of the slope [spatial]. There is no temporal reference.
4. Benchmark Problem:
The benchmark here will consist in simulating the time series of free surface elevations at the 21 labeled wave gauge and 4 runup gauge locations as indicated in Figure 2, along with details of slide geometry and motion. The benchmark is optional, and a model-data comparison table will be constructed for all 12 tests. In order to build up some model-model comparisons prior to the workshop, it would be helpful to concentrate initially on some of the "low pressure" (P58) tests, as these are likely to be the easiest to run.