DEPARTMENT OF POLITICAL SCIENCE
AND
INTERNATIONAL RELATIONS
Posc/Uapp 815
Data Types and Structures

- AGENDA FOR CLASS 4:
- Data types and structures
- Constructing and interpreting tables
- DATA STRUCTURES:
- Raw data matrix
- Cases X variables as in SPSS or MINITAB data windows.
- Example:
- Here are hypothetical data describing individuals. It could be drawn
from company files, a census survey, a poll, or whatever.
- Note: publically available surveys or polls will not contain
information that allows the reader or user to identify particular
individuals. Cases are recorded by identification numbers.
Individual |
ID Number |
Age |
Years of
schooling |
Family
income |
| Marsha |
0001 |
32 |
11 |
19000 |
| James |
0002 |
54 |
15 |
67000 |
| Lee |
0003 |
44 |
12 |
53000 |
| ... |
... |
... |
... |
... |
| Alberto |
1217 |
31 |
7 |
22000 |
- As noted in classes 2 and
3,
information of this sort, which can be
thought of as a "matrix," are electro-magnetically stored so that
rows represent cases and columns variables or indicators.
- An important note on storing data:
- When entering data into a worksheet or data window do not enter
commas, dollar signs, or percent indicators. You must, however, record
minus signs and decimal points.
- Here is another example of a data matrix based on Table 3.17 in Agresti and
Finlay, Statistical Methods:
| Table 1
Number of therapeutic abortions in 1988 in Canada
per 100 live births.1 |
Province |
ID
Number |
Rate |
Province |
ID
Number |
Rate |
Alberta |
01 |
15.0 |
British
Columbia |
02 |
25.5 |
Manitoba |
03 |
16.6 |
New
Brunswick |
04 |
4.9 |
Newfoundland |
05 |
6.3 |
Nova Scotia |
06 |
14.2 |
Ontario |
07 |
20.9 |
Prince Edward
Island |
08 |
3.5 |
| Quebec |
09 |
14.7 |
Saskatchewan |
10 |
7.7 |
| Yukon |
11 |
22.6 |
Northwest
Territories |
12 |
17.9 |
1 Source: Canada Year Book, 1991. Adapted from Agresti and Finlay, Statistical Methods for the Social
Sciences, 3rd edition, page 76.
- Note: the data are rates, rather than raw numbers. Why?
- In this example there are 12 cases and just one variable. The name and
identification numbers are not normally considered variables.
- Programs such as MINITAB and SPSS automatically keep track of row
numbers so there is no need to enter them.
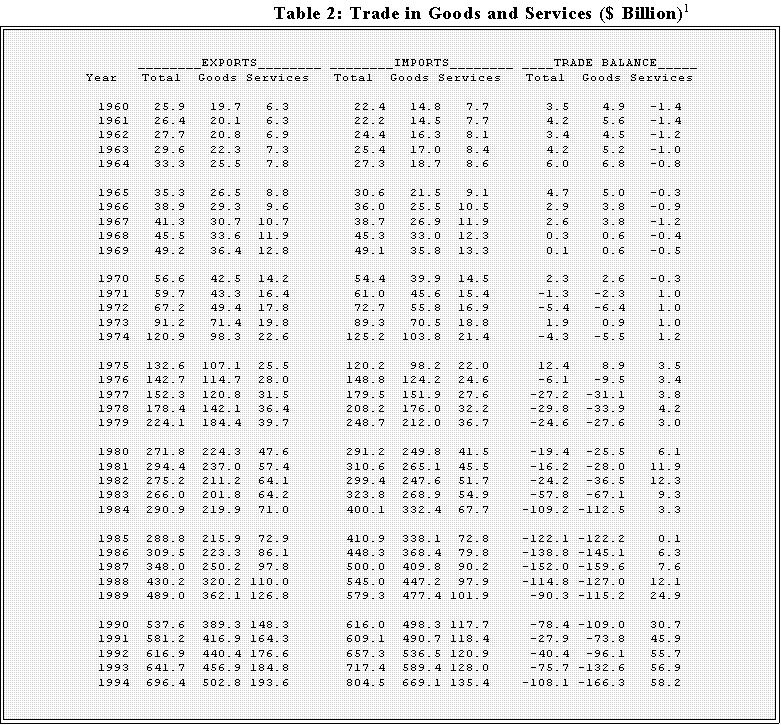
- Another example: time series data. (See Table 3 on the next page.)
- Here the units are "years."
- Note too that the entries represent billions of dollars so that, for instance,
25.9 represents $25.9 billion or 25,900,000,000. -1.4 means a $1.4
negative balance.

1 Note: Balance of payments basis for goods reflects adjustments for timing, coverage, and valuation to the data
compiled by the Census Bureau. The major adjustments concern military trade of U.S. defense agencies, additional
nonmonetary gold transactions, and inland freight in Canada and Mexico. Goods valuation: f.a.s for exports and
customs value for imports. Data reflect all revisions through June 1994.
Source: Department of Commerce: Bureau of Economic Analysis, Bureau of the Census Appendix C: Highlights
of U.S. Foreign Trade.
- Survey Data
- Responses to public opinion and other types of survey questions are usually
stored as numbers according to a "code book."
- For example, suppose a sample of people are asked for their opinions about
abortion. If a question calls for a simple "yes or no" response, how can the
answers be recorded numerically for use in a statistical package?
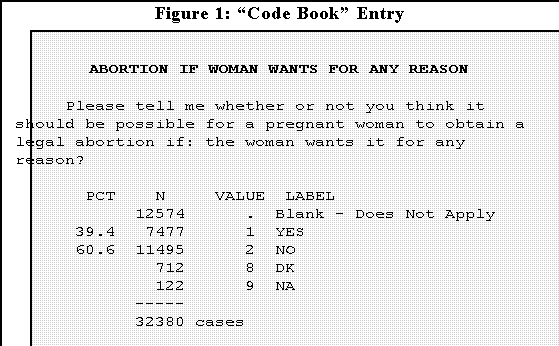
- Most researchers use a "code book." Here's an example taken from the
1972-1994 General Social Survey Cumulative File:

- In this case if a person answers "yes," then the individual is coded "1" on
this variable; if the answer is "no," the person gets a "2."
- A person who doesn't know or didn't answer the question is coded
8 or 9.
- The code book shows the response label, the corresponding code, and here
the number and percent of the total sample giving each response.
- There are total of 32,380 cases in this study.
- See later for the use of the code book.
- DATA IN TABULAR FORM:
- Data are frequently summarized and presented in tabular form
- Table of counts or frequencies.
- Example
from the Statistical Abstract of the United States, 1996
, p. 398:

- Here the table entries are (mostly) counts rounded so that each one has to
be multiplied by 1,000 to get the true meaning.
- Example: total population of people aged 16 to 24 in 1980 was
37,103 times 1,000 or 37,103,000 or 37.1 million. Of these
24,918,000 or 24.9 million were in the civilian labor force.
- That's what percent?
- An aside: in the social, behavioral, and policy sciences great
precision in reporting numbers--data reported to 3 or 4 decimal
places or written out fully--is usually not necessary and can leads to
a false sense of accuracy.
- This table also shows multivariate relationships: it shows school
enrollment by age, labor force status, and race. (See below.)
- Note how well the table is labeled: it cites sources
- Tables of percentages.
- Here's the sort of table (or list) one finds in newspapers and magazines
(cited in National Journal, August 16, 1997):
| Do you approve or disapprove of the way that Congress is handling its job?
(Gallup Organization for CNN-USA Today, 7/97)
|
| Approve |
34% |
| Disapprove |
57 |
| No opinion |
9 |
- Percent means per 100, of course.
- A couple of points.
- Most papers unfortunately do not report the sample size or N upon
which the percentages are calculated. So is it 34% of 50 people or
500 or 5000 who approve the way Congress is handling its job?
This omission makes interpretation difficult.
- Note also that the categories have no doubt been "cleaned" to
remove possibly confusing information. But the omitted material
may be crucial. For example, does "no opinion" genuinely represent
an absent of opinions or a failures to ask and/or record answers or
both?
- In this form the information is not especially helpful; if possible try
to find the original data and calculate your own percentages.
- A Cross-tabulation or cross-classification:.
- This type of table shows frequencies and/or percentages of various
combinations of two or more variables.
- Example:
- Here's a typical table derived from the General Social Survey
Cumulative 1972-1994 file.
- If you want to look at survey, click here.
- The question was: Please tell me whether or not you think it should
be possible for a pregnant woman to obtain a legal abortion if the
woman wants it for any reason?
|
White |
Black |
Other |
Totals |
Yes |
6350
40.3 |
943
34.8 |
184
36.4 |
7477
39.4 |
No |
9486
59.7 |
1768
65.2 |
321
63.6 |
11495
60.6 |
| Totals |
15756 |
2711 |
505 |
18972 |
| Means
Std. Deviations |
1.60
.49 |
1.65
.48 |
1.64
.48 |
1.61
.49 |
- Parts of the table:
- The table cross-classifies two variables. It shows, in other words,
the joint distribution of race and opinion: each cell in the table body
contains the frequency or number of respondents who have a
particular combination of "scores" on the two variables.
- Actually, this table shows both frequencies (often called "counts")
and percents. (It has other information as well.)
- "I prefer that the dependent variable categories appear along the
rows--that is the row variable is dependent--and the independent
variable be the column factor. The choice is arbitrary, however.
- Percents are usually calculated as the proportion (times 100) of a
independent variable category total frequency.
- So, for example, 6350 is 40.3 percent of 15,756.
- 6350 is the cell frequency; 15,756 is the first (white) column
marginal total.
- The total number of cases or sample size, N, is 18,972.
- In this case the means are the average (mean) scores for each
column assuming "Yes" equals 1 and "No" equals 2.
- A cross-classification of means:
- This table displays the relationship among three variables.
Weighted-average functional literacy scores and jobs of the prime
working-age (25-49) population, 1992
| Highest level of
education |
|
Average level of education in job, 1971-72
Occupational tier1 |
|
Total |
1 |
2 |
3 |
4 |
| Total |
294 |
262 |
282 |
309 |
335 |
| High school drop out |
236 |
231 |
246 |
259 |
- |
| High school diploma |
279 |
267 |
280 |
292 |
297 |
| Some college |
307 |
291 |
301 |
311 |
322 |
| College degree |
333 |
- |
316 |
331 |
340 |
1 Occupations ranked by average education of practitioners in 1971-72. Tier 1: 10.5 or fewer years; tier 2: 10.6 to
12.0 years; tier 3: 12.1 to 14.6 years; tier 4: 14.6 or more years.
- Here the entries are the mean "functional literacy" test scores of people in
various combinations of X and W, the two independent variables.
- Literacy test score is a third variable.
- Hence, the average functional literacy score of people who dropped out of
high school and who have "tier 1" occupations is 294. The corresponding
average score for those who have tier 4 jobs is 335.
- Aside: this is an important table and study. I suggest everyone try to get a
copy and read it.(1)
- A complex table such as this one contains a huge number of comparisons,
some of which we will explore now and later.
- Consider, for example, college and university graduates. Those in
tier 1 occupations--the "good jobs" in the popular press--have
literacy scores that are somewhat higher than graduates holding tier
2 or 3 jobs.
- This makes sense and seems obvious until one thinks about the
ramifications. Having a BS or BA does not guarantee one great
employment as everyone knows. But the table's authors point out
that the separation probably occurs because some graduates have
higher functional literacy than others and they get the best jobs. So,
to get the most from higher education, one should not simply
collect degrees or major in specialities. Instead, it's important to
develop critical reading and composition skills.
- NEXT TIME:
- Descriptive statistics.
1. Frederick L. Pryor and David Schaffer, "Wages and the University Educated," Monthly
Labor Review July, 1997, 3-14.

 Go to Statistics main page
 Go
to H. T. Reynolds page.
Copyright © 1997 H. T. Reynolds


