DEPARTMENT OF POLITICAL SCIENCE

AND

INTERNATIONAL RELATIONS


Windows and MINITAB

  1. AGENDA:
    1. Some further remarks about the course
    2. A brief discussion of Windows
    3. The importance of saving data
    4. MINITAB
      1. A simple example: comparative educational statistics
      2. Entering and saving data
      3. MINITAB statistics and graphs.
    5. Reading:
      1. The Student Edition of MINITAB for Windows, Chapters 2, 4, 5 and first 18 pages of the Tutorial.
        1. Try the software on your own.
        2. For installation see Chapter 3


  2. THE COURSE:
    1. Software: public sites contain "full" versions of MINITAB and SPSS.
      1. The"Student Edition" is a fully functional subset of the regular program that meets our needs.
    2. Try software before buying.
      1. Student Edition of MINITAB works on Windows 3.1 and 95
      2. Installation directions in book


  3. WINDOWS DEMONSTRATION:
    1. Some basics
      1. Note: there are many different ways to do the same thing.
      2. The desktop
      3. Multiple windows
        1. Sizing, opening, closing, minimizing (hiding) windows
        2. Scrolling
      4. Menu and task bars
        1. "Dialogue" boxes
      5. Keeping track of windows: the title bar
      6. "GUIs"
      7. Mouse, pointer, cursor, insertion point
    2. Moving information from one window to another.
      1. The clipboard
    3. Help menus


  4. KEEPING DATA FOR FUTURE USE:
    1. It is important that you know how to save data and other information in proper formats.
    2. Folders and files
    3. MINITAB (and SPSS) file formats versus plain "text" data.
    4. Public versus private desktop machines.
      1. If you are using a public site, be sure to save your data and results on your own diskette.
      2. Before starting make sure that you have a formatted disk.
    5. To format a disk with Windows 95
      1. SeeFigure 2 and Figure 3
      2. Make certain write tab is not in protected position.
      3. Insert a blank (unused) disks into (usually) the A: drive
      4. Double click on "My Computer" (on desktop) or click Start button (at lower left of monitor) and then Windows Explorer.
      5. Double click on 31/2 Floppy
      6. Follow the instructions: check "full" and type a label if you want one.


  5. COMPARATIVE EDUCATION STATISTICS:
    1. Table 1 provides some data relevant to a current policy issue, comparative test scores.
      1. What is the average score among the 10 countries?
      2. How far is the United States from the average?
      3. How much variation is there?
      4. What, if anything, "explains" this variation?
    2. To illustrate MINITAB let's
      1. Enter the data into a "worksheet" or "spreadsheet."
      2. Save the data for future use
      3. Obtain some descriptive measures of "central tendency" and variability.
      4. "Plot" pairs of variables to see if we can "explain" the variation in the test results.
        1. Data are on the next page

Table 1

Classroom, home, and mathematics Activities of 9-year Olds in Educational Systems Participating in the International assessment of Educational Programs: 1991(1)
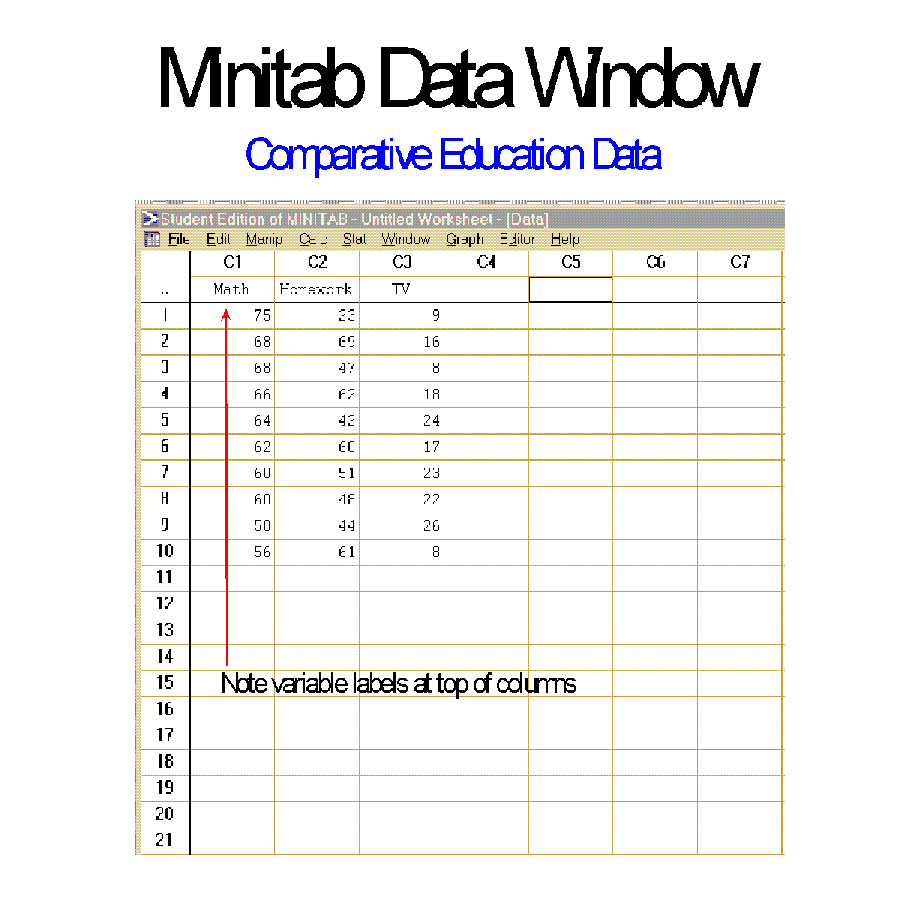


Nation


Average % correct on

mathematics test

% of students who do math exercises by themselves often % of students who watch TV 5 or more hours daily
Korea 75 23 9
Hungary 68 69 16
Taiwan 68 47 8
(Former) Soviet Union 66 62 18
Israel 64 42 24
Spain 62 60 17
Ireland 60 51 23
Canada 60 48 22
United States 58 44 26
Slovenia 56 61 8


  1. MINITAB:
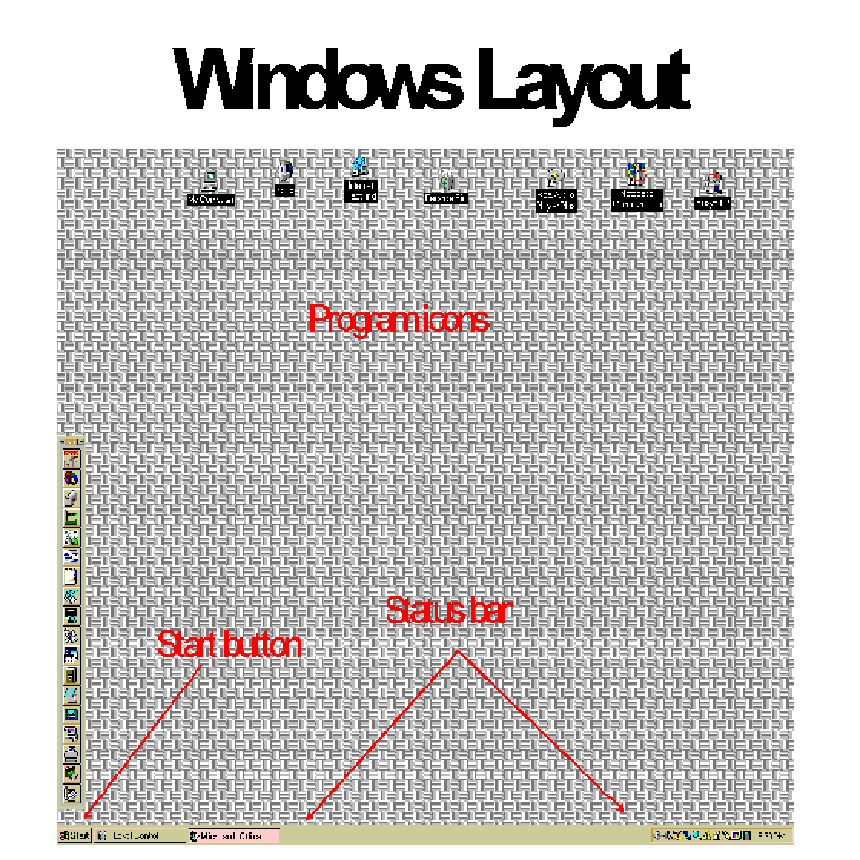
    1. Start the program by clicking Windows start button, moving cursor to program name, and clicking.
    2. "Resize" the windows as needed.
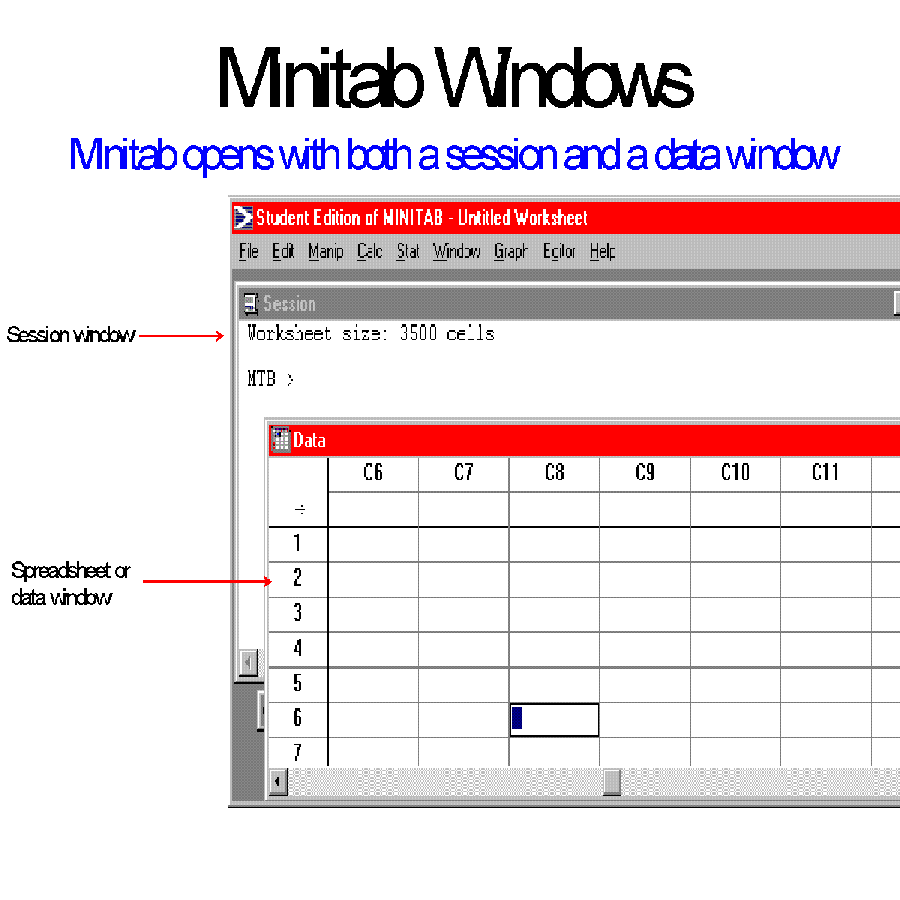
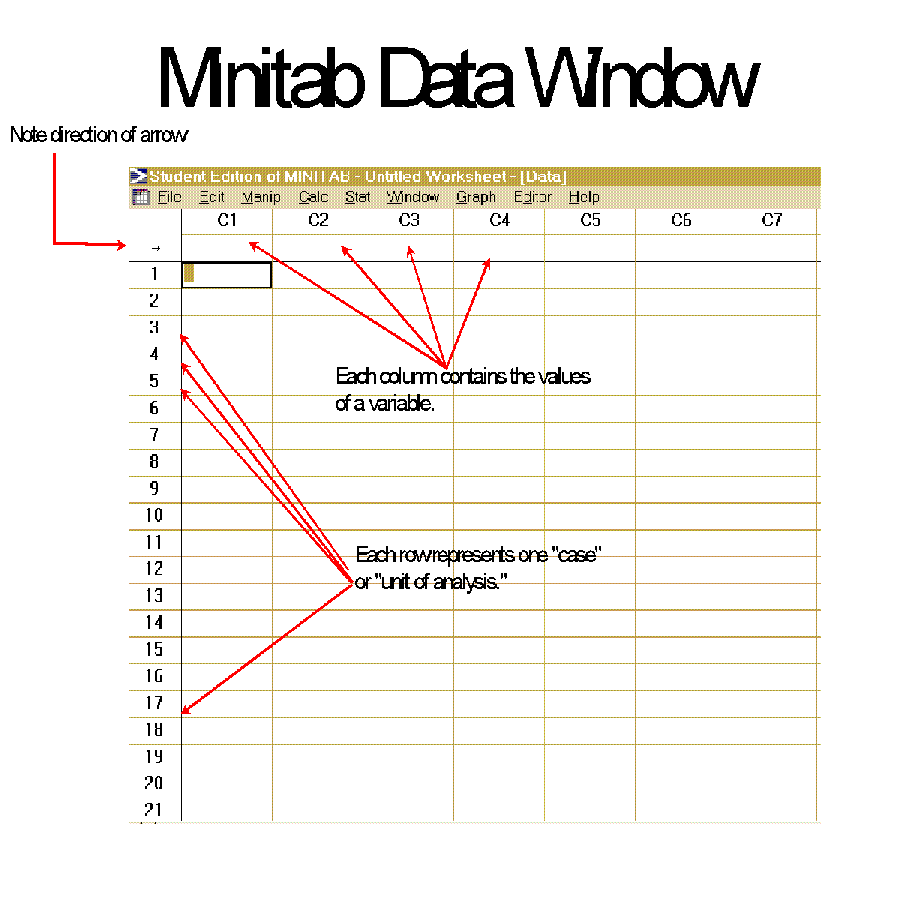
    3. See Figure 4
    4. Open data window first.
    5. See Figure 5
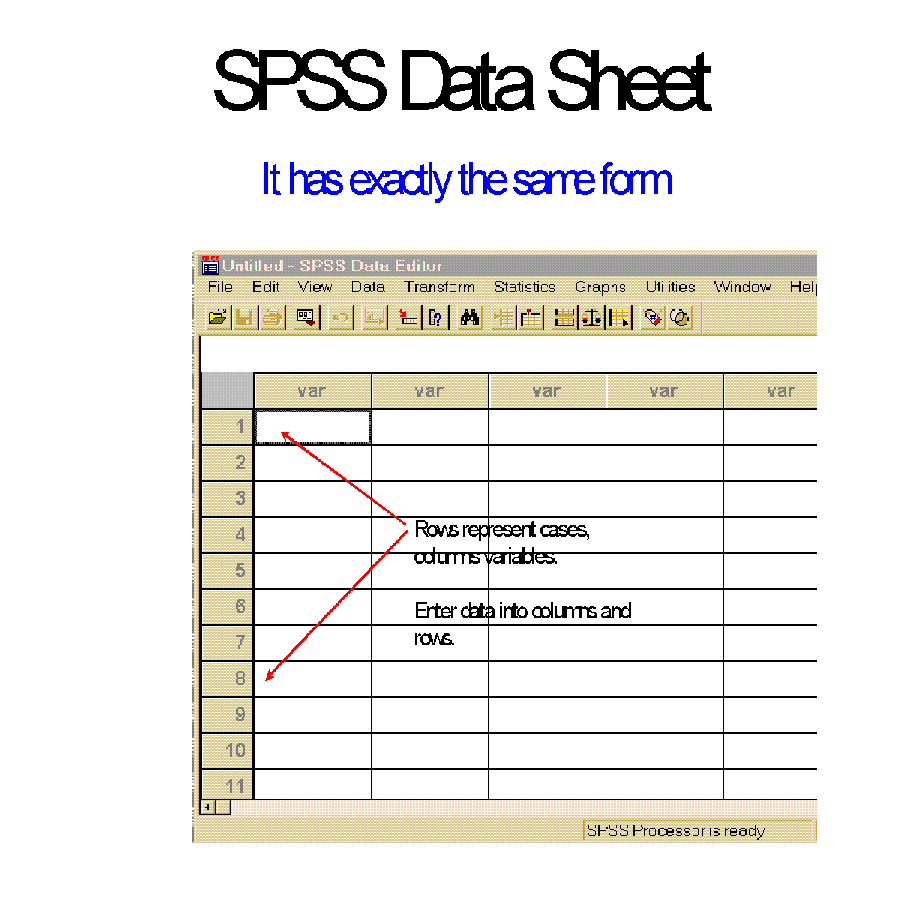
    6. SPSS window (Figure 6) is nearly the same
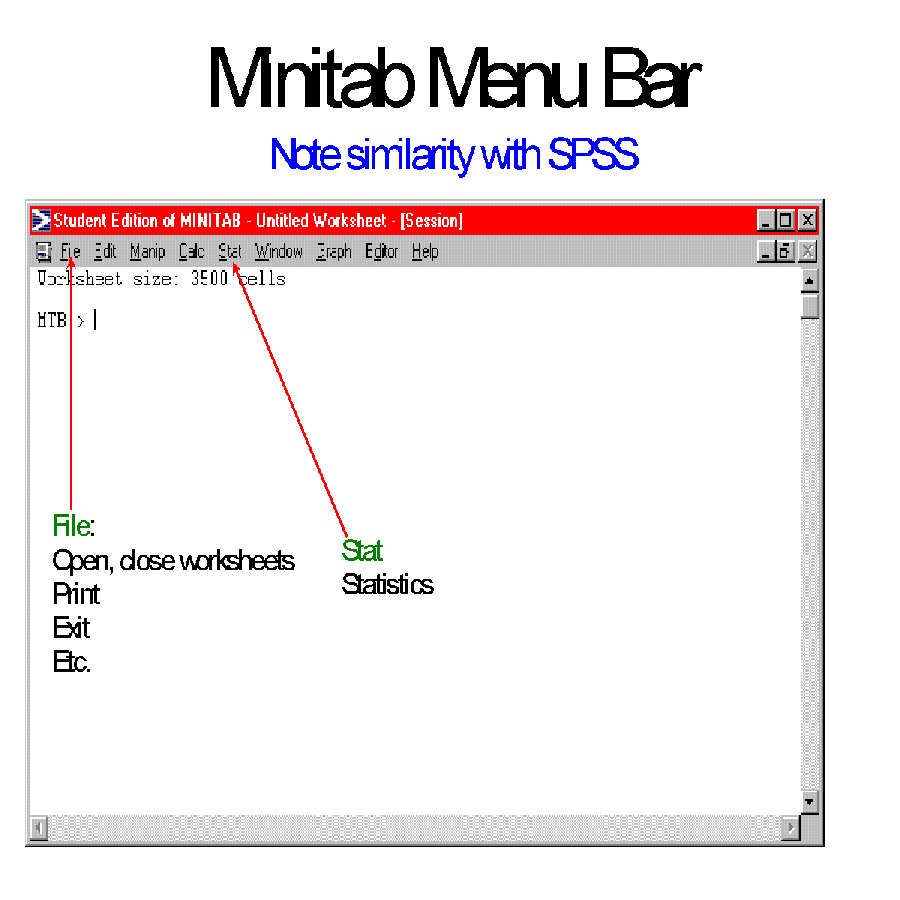
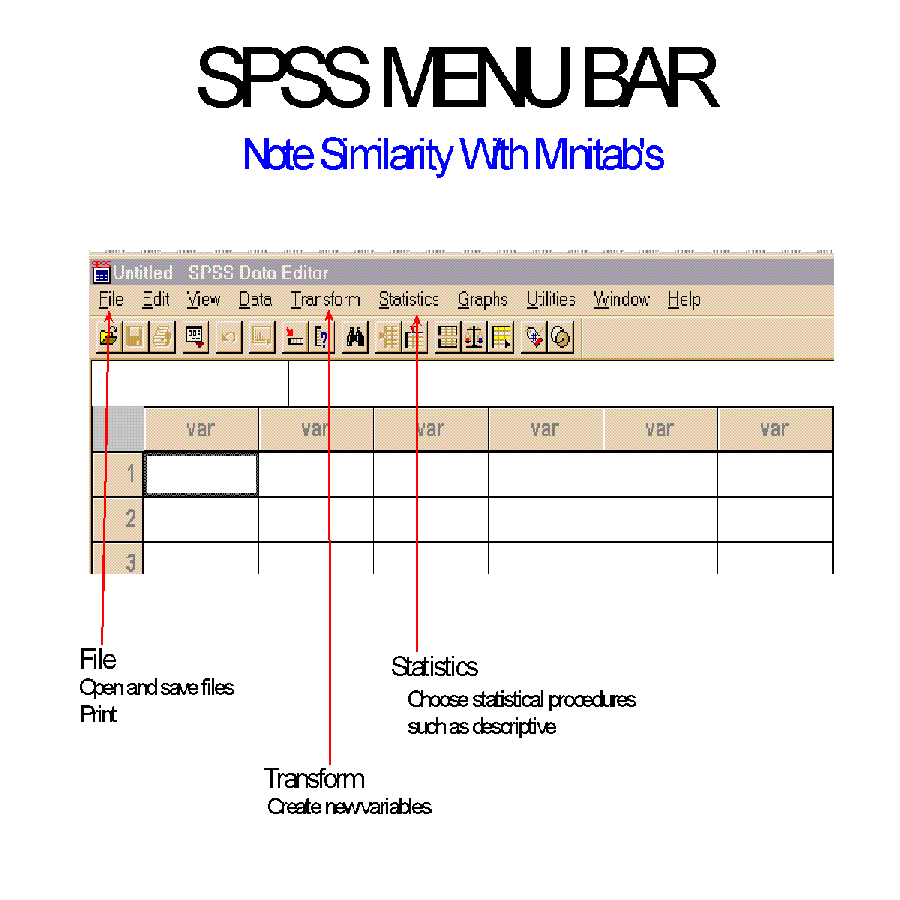
    7. Now look at "menu bars"
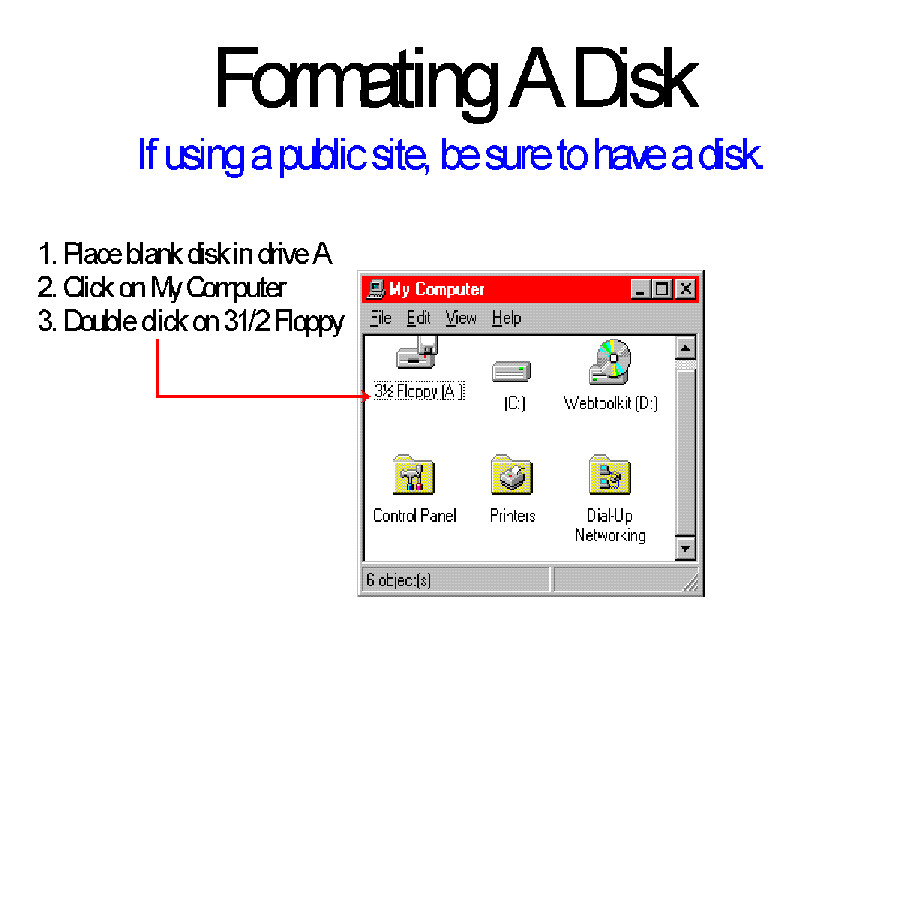
    8. Click arrow in upper left corner to make it point down.
    9. Enter numbers in columns starting with first row.
      1. Type 75, press enter key, type 68 in the next row, etc.
        1. In MINITAB and SPSS never enter percent signs or commas; only numbers and decimals.
    10. Use cursor or pointer to highlight box at top of column.
    11. Type a short name, one having less than 8 characters.
    12. Enter and name other data.
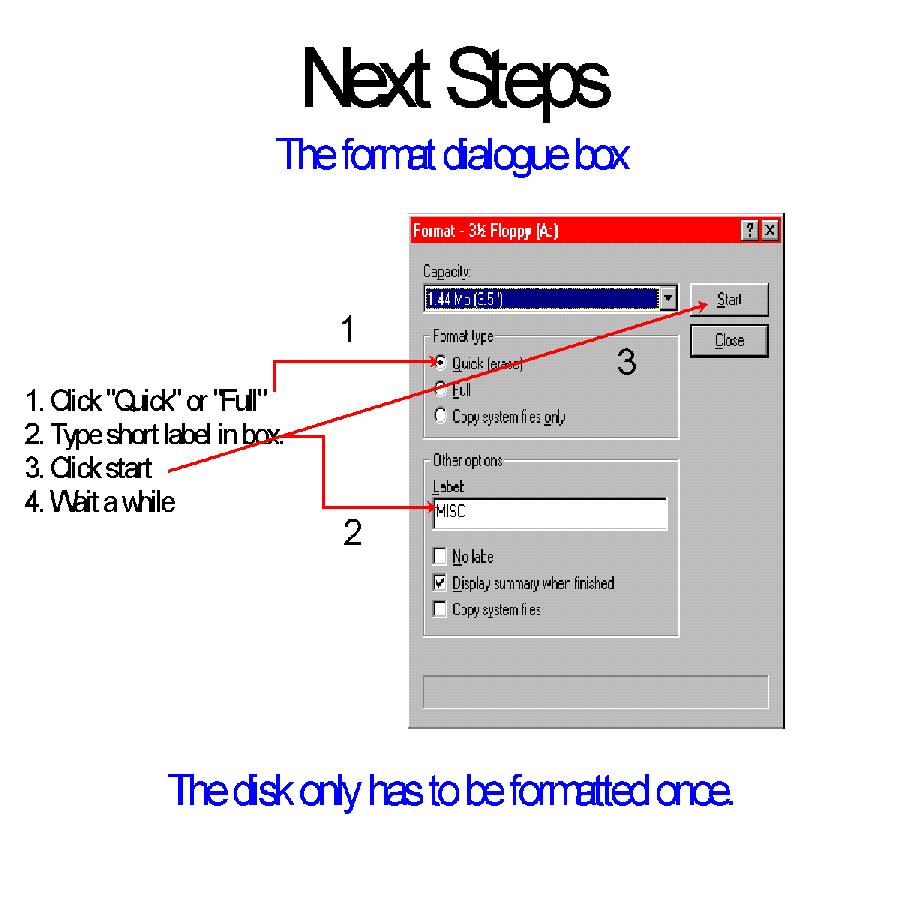
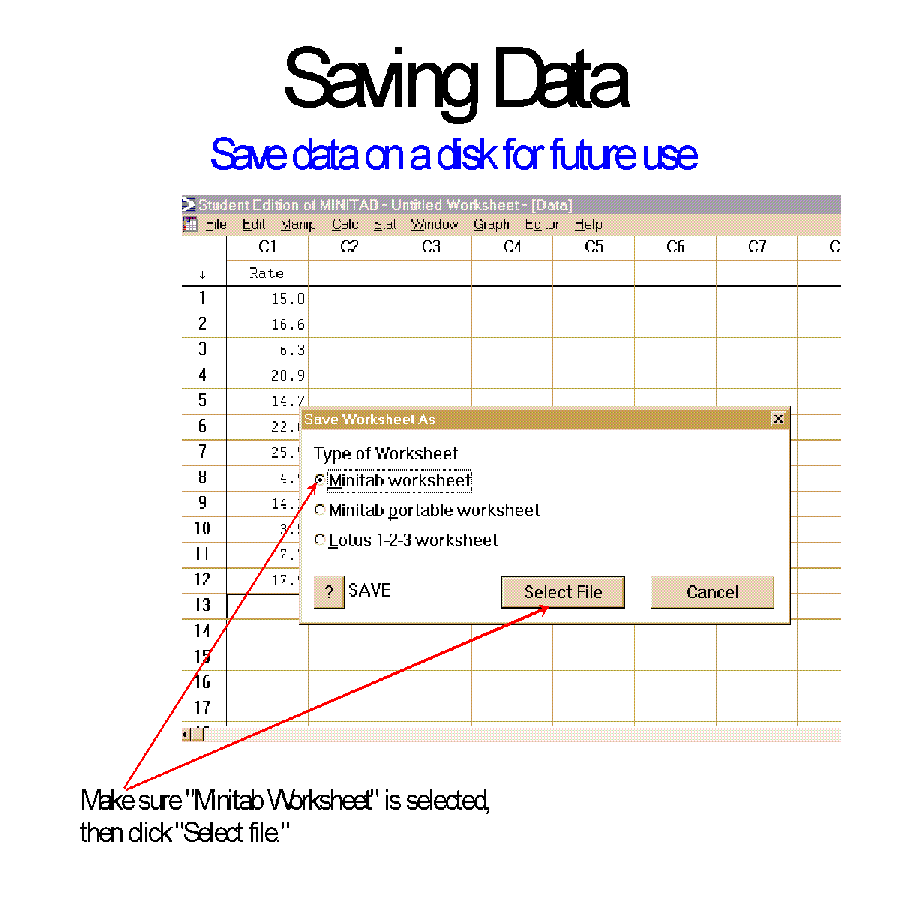
    13. Click file, then Save worksheet as...
      1. Under type of worksheet select MINITAB
      2. Click Select File
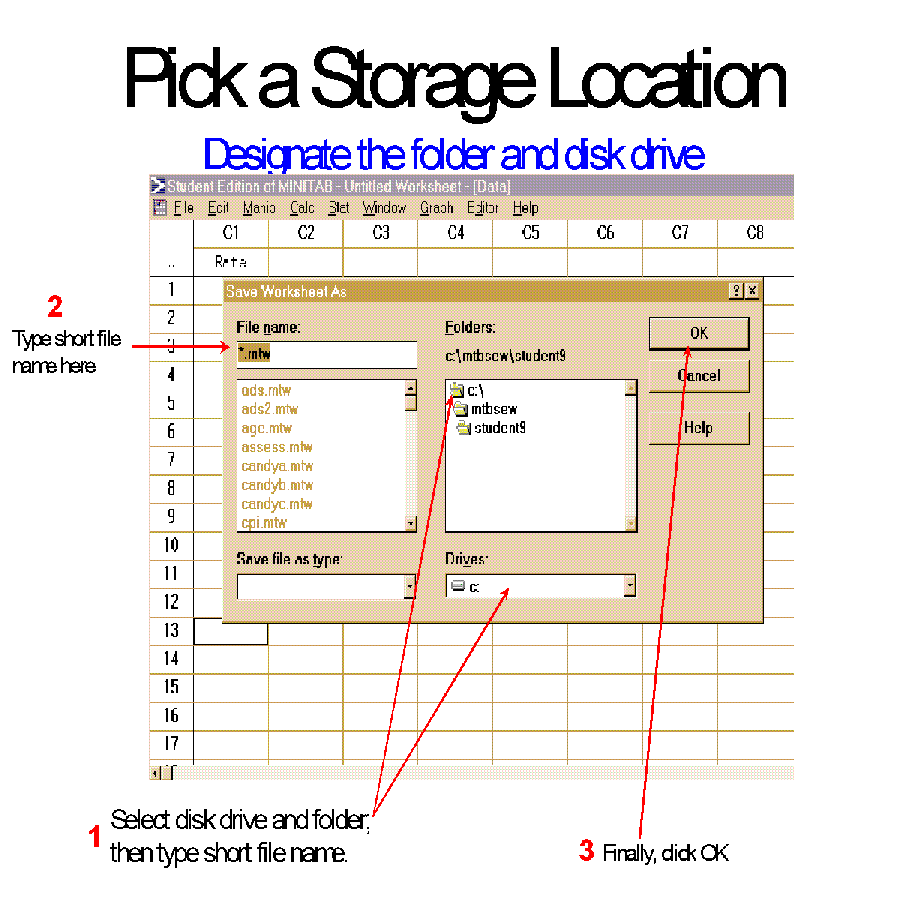
      3. Fill in the dialogue box. (See Figure 10 and Figure 11)
        1. Make sure that you save the file in the proper location.
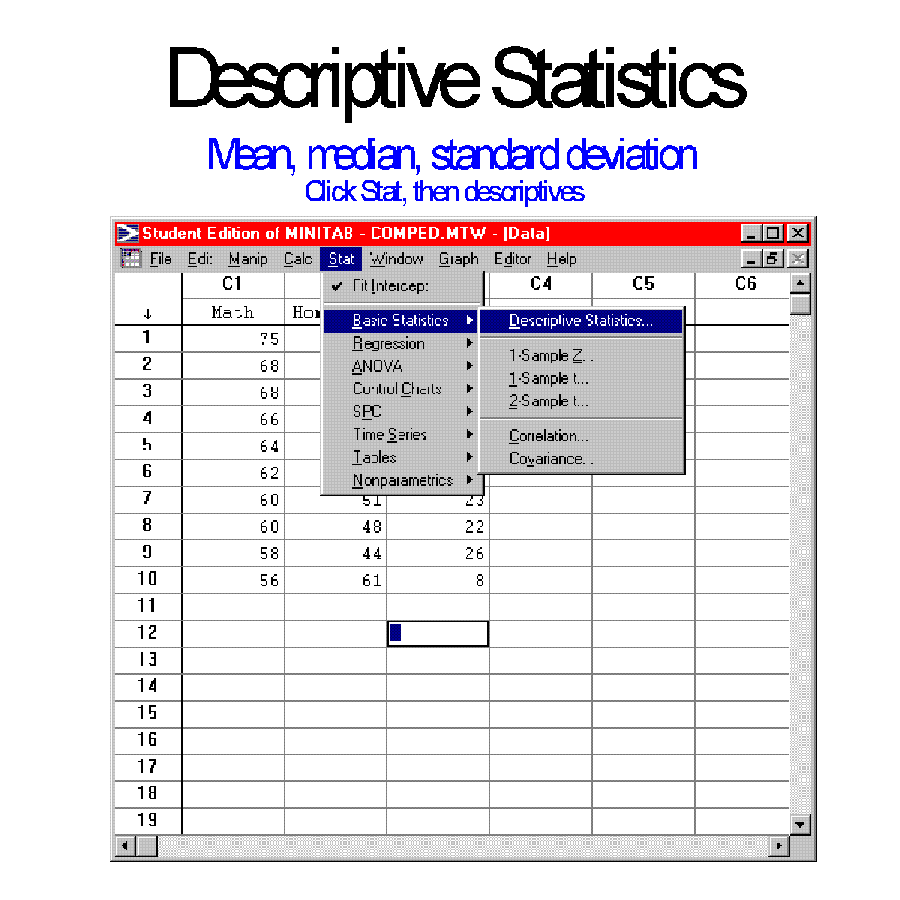
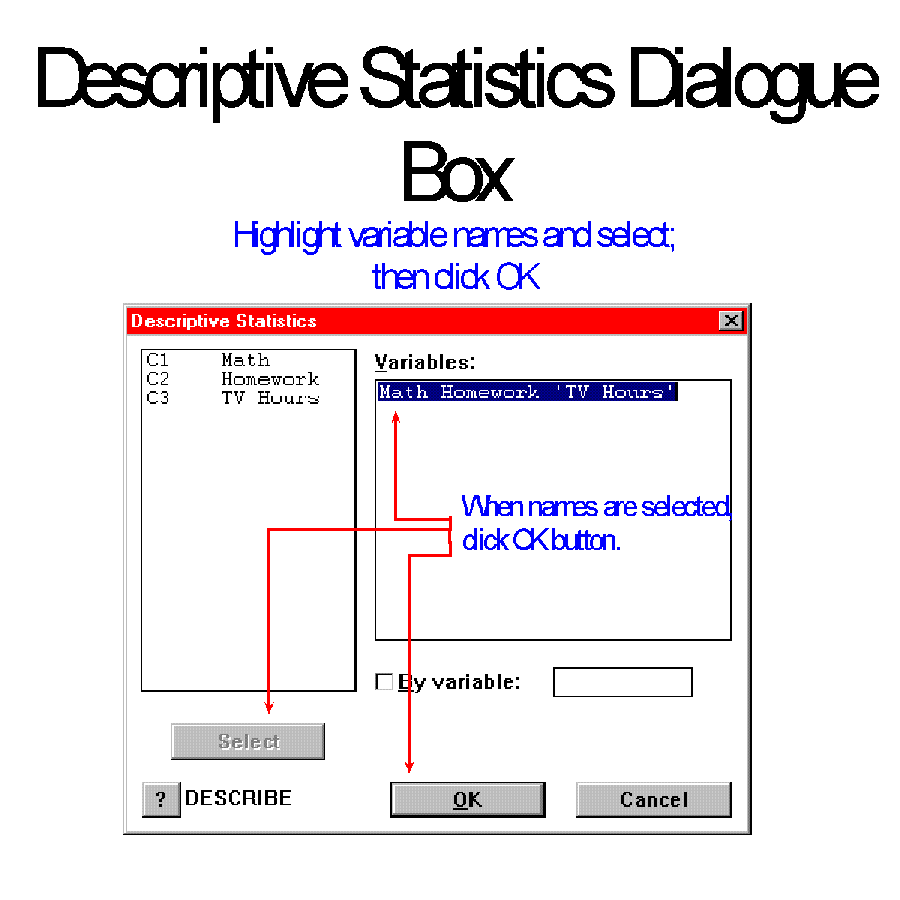
    14. Click Stat, then Basic Statistics
      1. See Figure 12 and Figure 13
      2. Highlight variable names by clicking on them and then clicking Select
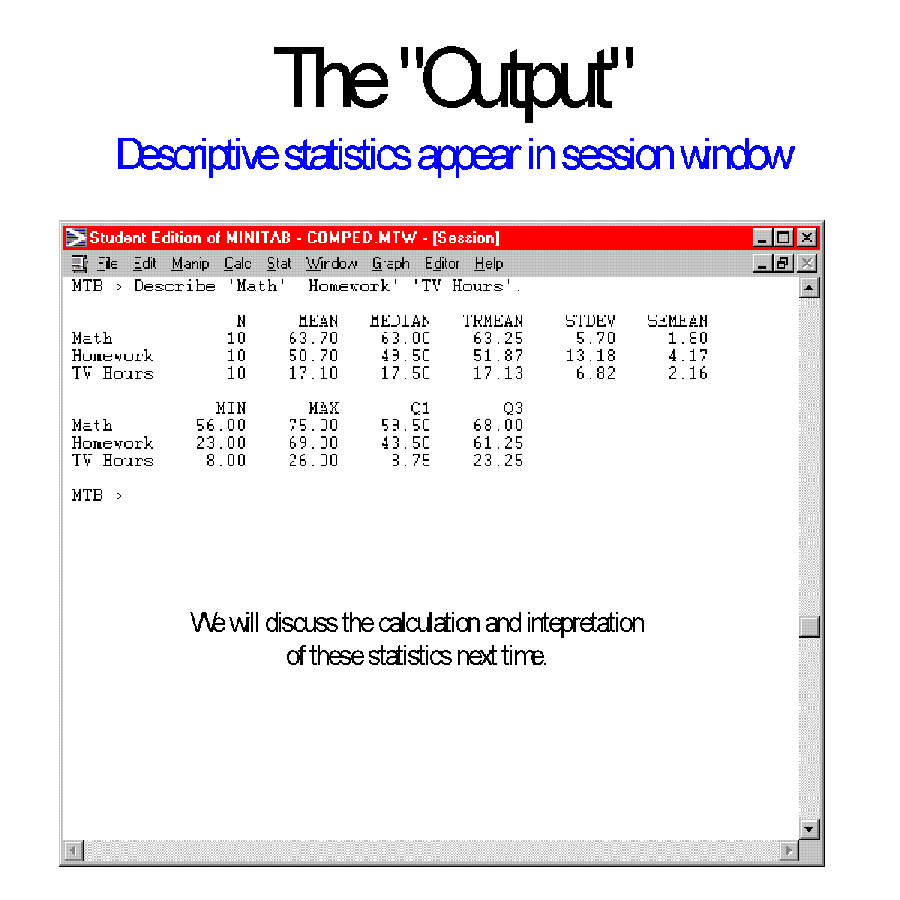
      3. Click OK to obtain statistics, which will appear in the session window.
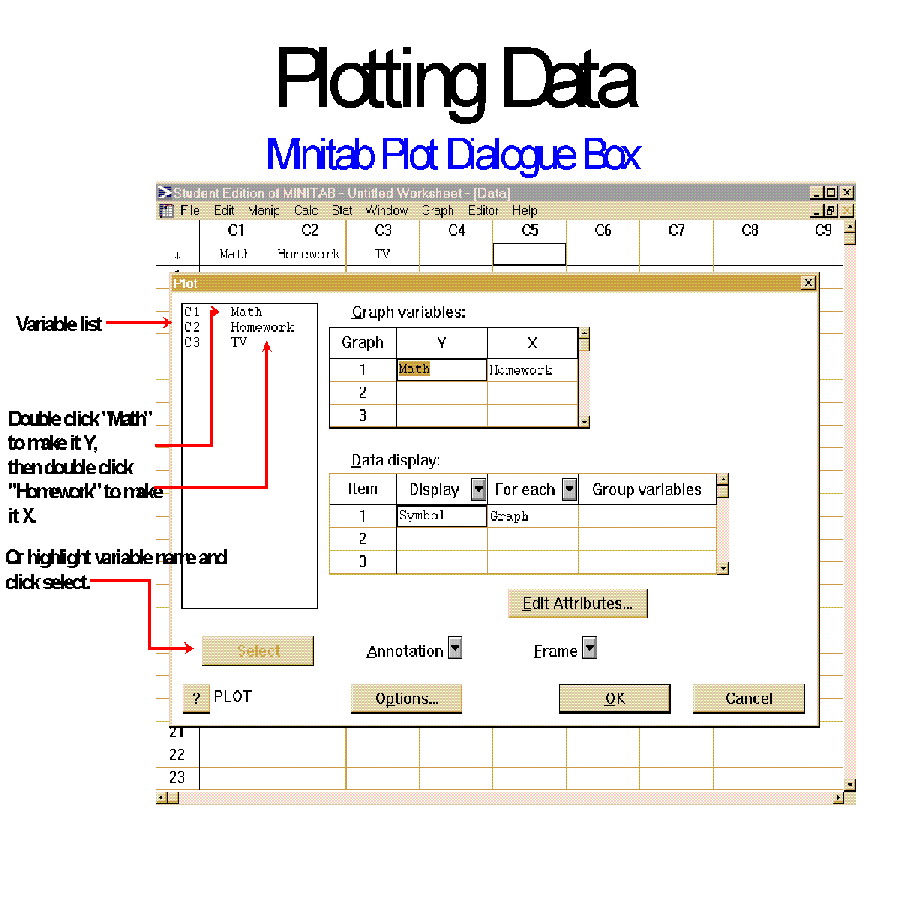
    15. Click Graph, then Plot...
      1. Fill in dialogue box.
      2. Figure 15
      3. Note: the dependent variable should always be Y or the horizontal variable. The independent variable is X.
      4. Click OK
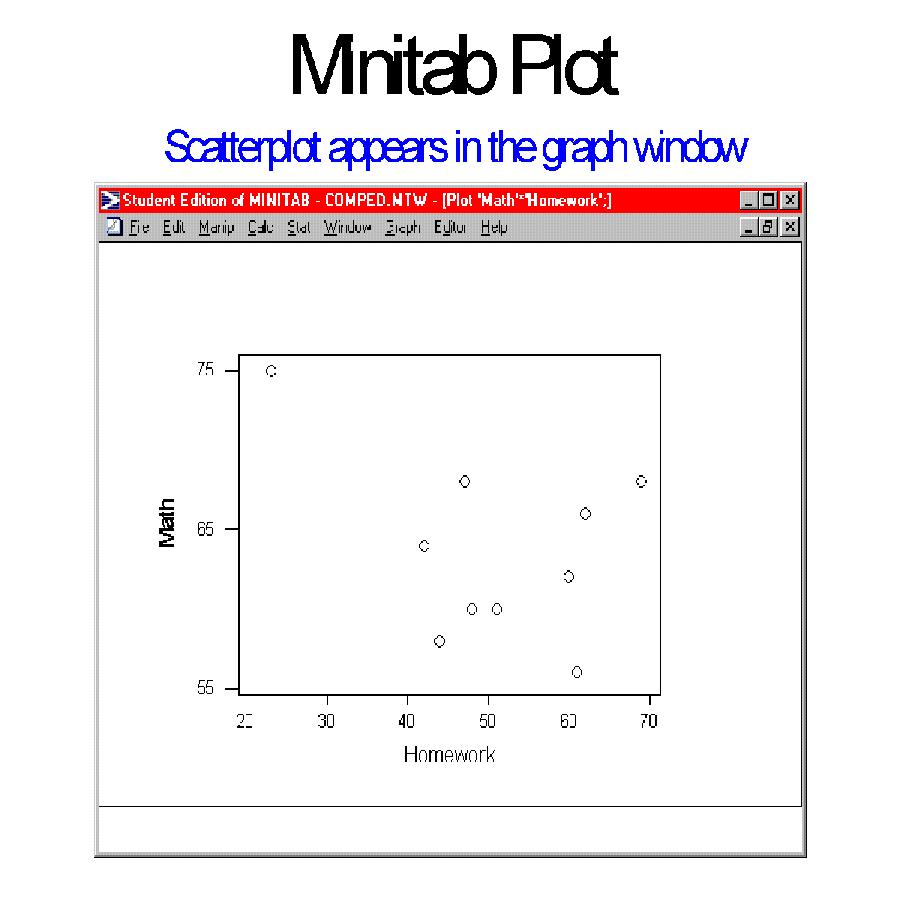
      5. The graph appears in the Graph window.
      6. See these figures:
    16. Click File, then Exit


  2. NEXT TIME:
    1. Further examples of MINITAB


1. Source: National Center for Educational Statistics, Digest of Education Statistics, 1994, Table 387 (p. 419).

Go to table

Go to Statistics main page

Go to H. T. Reynolds page.

Copyright © 1997 H. T. Reynolds
This Home Page was created by WebEdit,Wednesday September 3, 1997