DEPARTMENT OF POLITICAL SCIENCE
AND
INTERNATIONAL RELATIONS
STATISTICAL COMPUTING: MINITAB

- AGENDA:
- Internet and MINITAB demonstration
- Data types and structures
- Reading:
- The Student Edition of MINITAB for Windows, Tutorial pages 18 to 33.
- Try second tutorial.
- Agresti and Finlay, Statistical Methods, pages 12 to 17.
- SUBSTANTIVE PROBLEM:
- Racial differences in educational achievement.
- Is there a gap white-black rates of high school graduation? What is the
trend in this difference over the last 30 years or so?
- Strategy:
- Look for sources of data.
- After finding the information, copy it from the source to the desktop.
- If there is a considerable amount of information, we want to avoid
having to transcribe the data by hand. So we will copy and store the
table(s) on our disks and then use a word processor to...
- Convert data so they can used in a statistical program like SPSS or
MINITAB.
- Use the software to create the variable of interest and help answer the
questions.
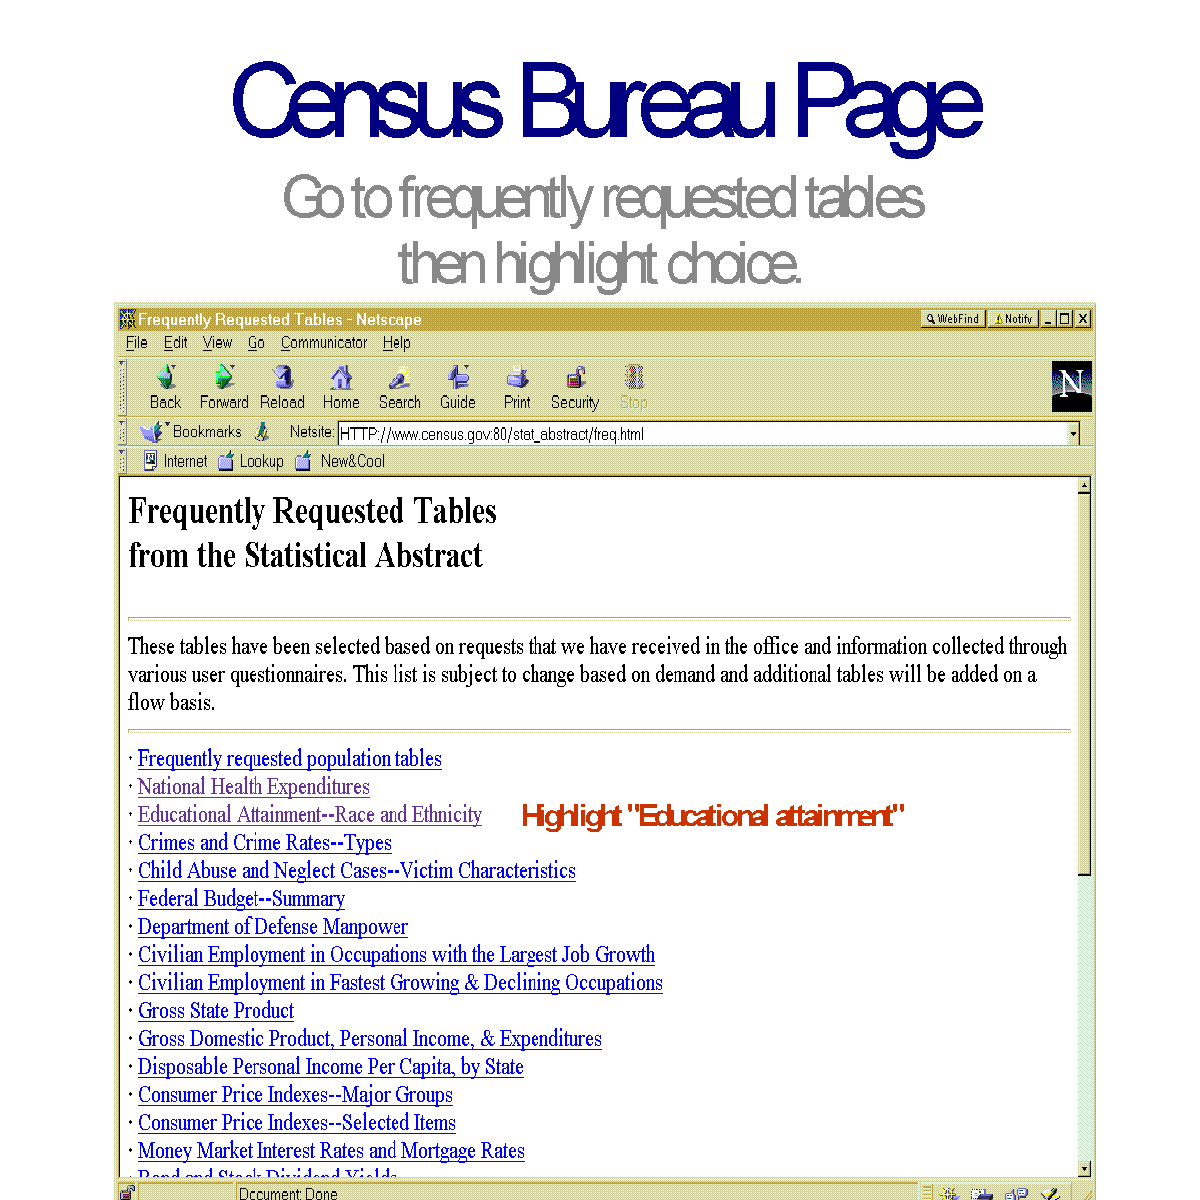
- THE INTERNET:
- Use a browser to "visit" the Census Bureau's web site.
- In particular, look for the Statistical Abstract of the United States.
- Find "Educational Attainment" table.
- Among other things it gives graduation rates for whites and blacks
for various years
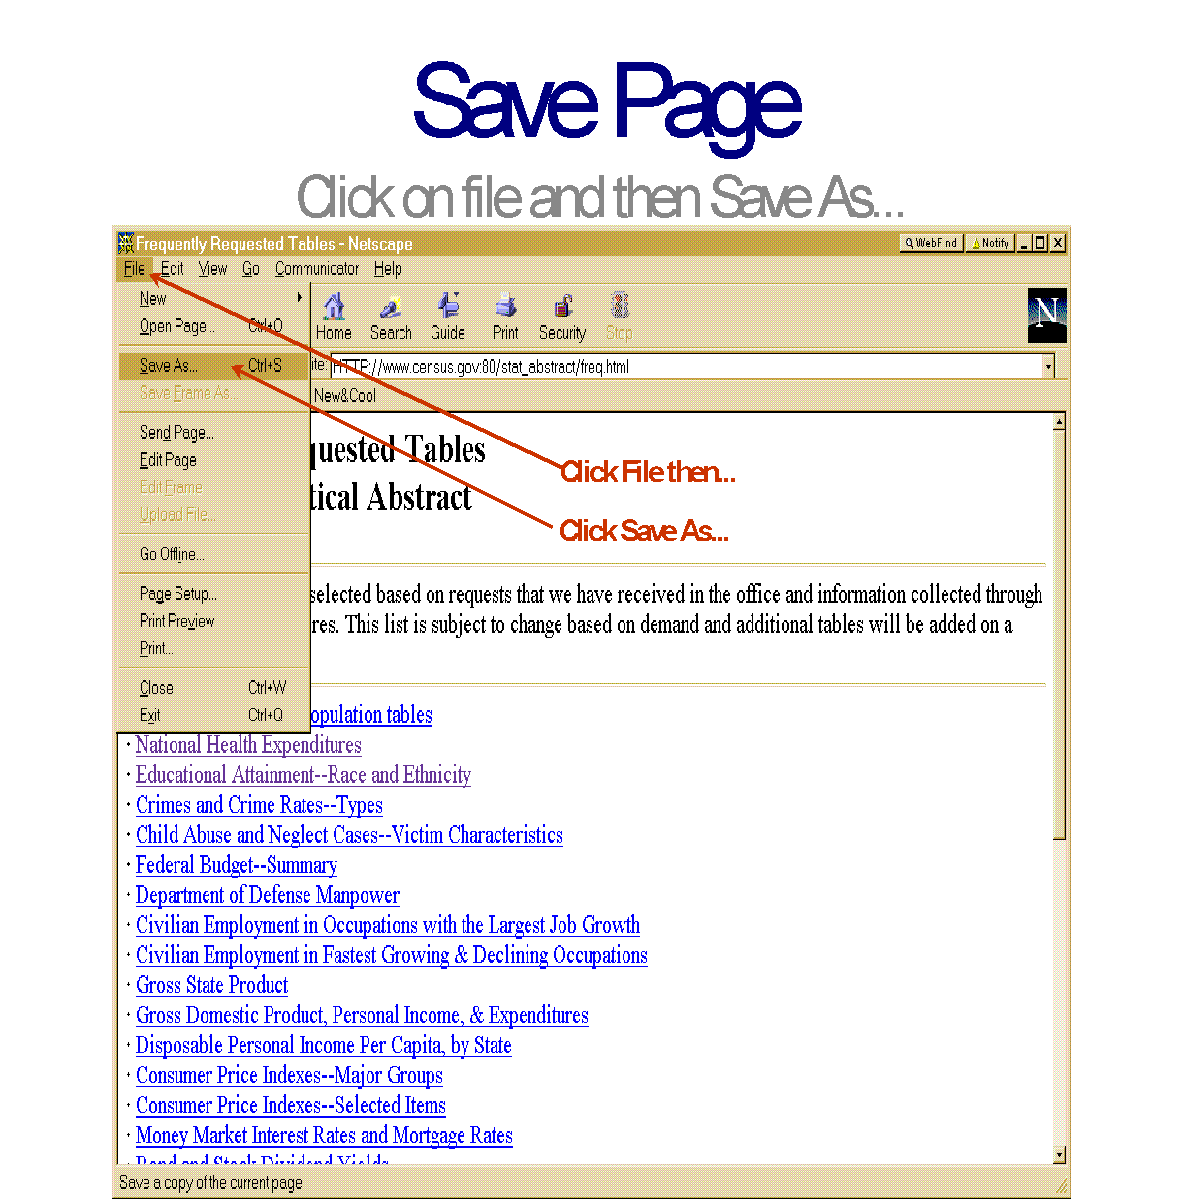
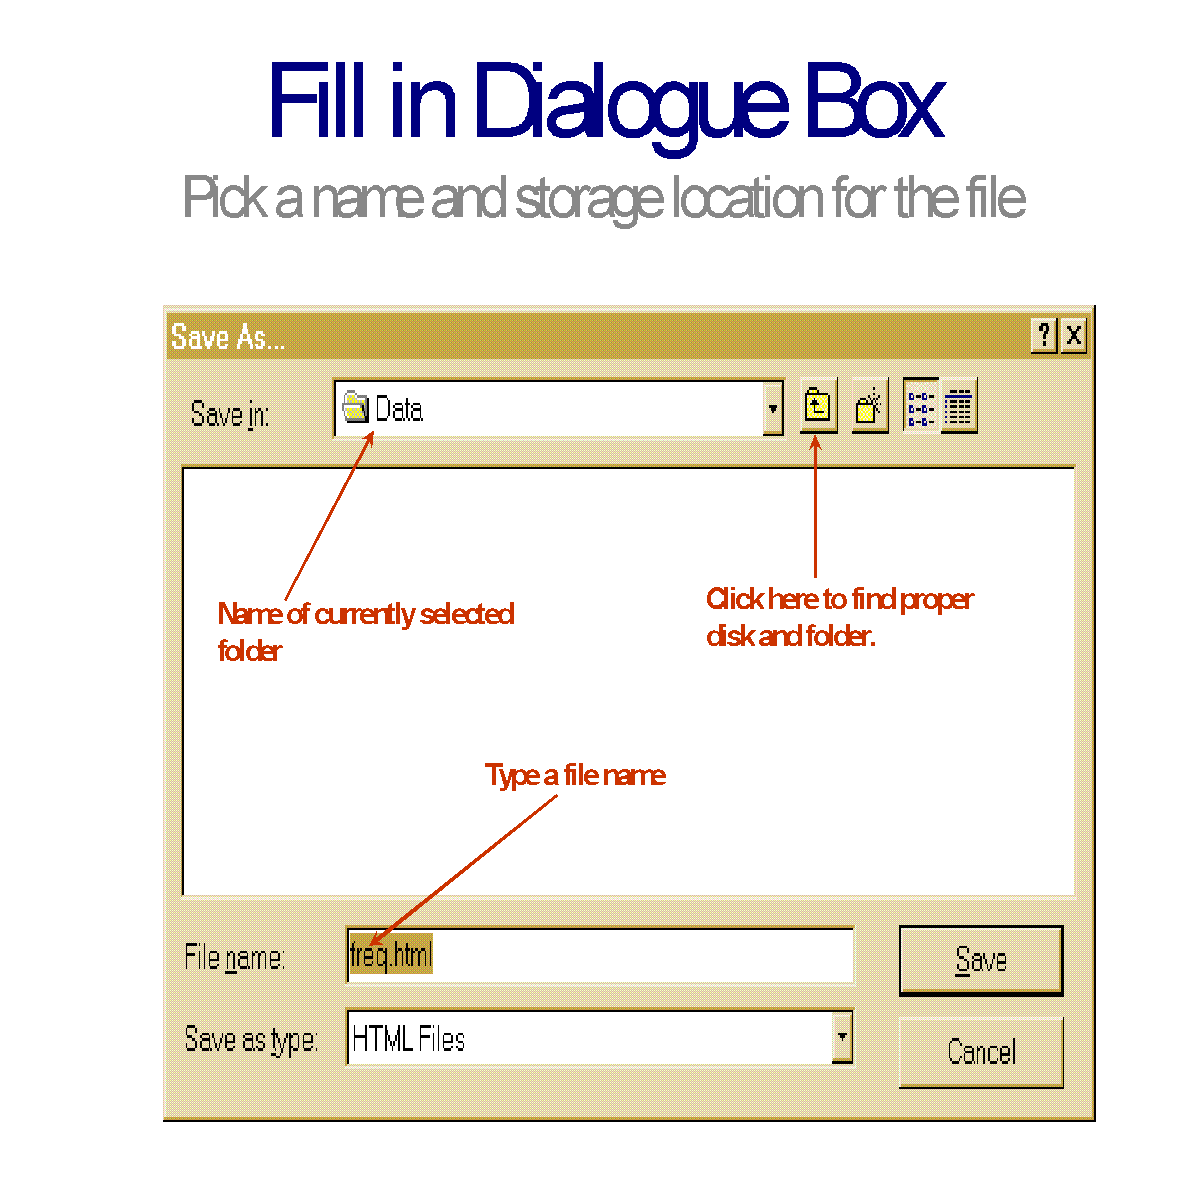
- Use your browser's "Save As" feature to copy the table to the hard drive.
- See Figures 1
- See Figures 2
- See Figures 3
- See Figures 4
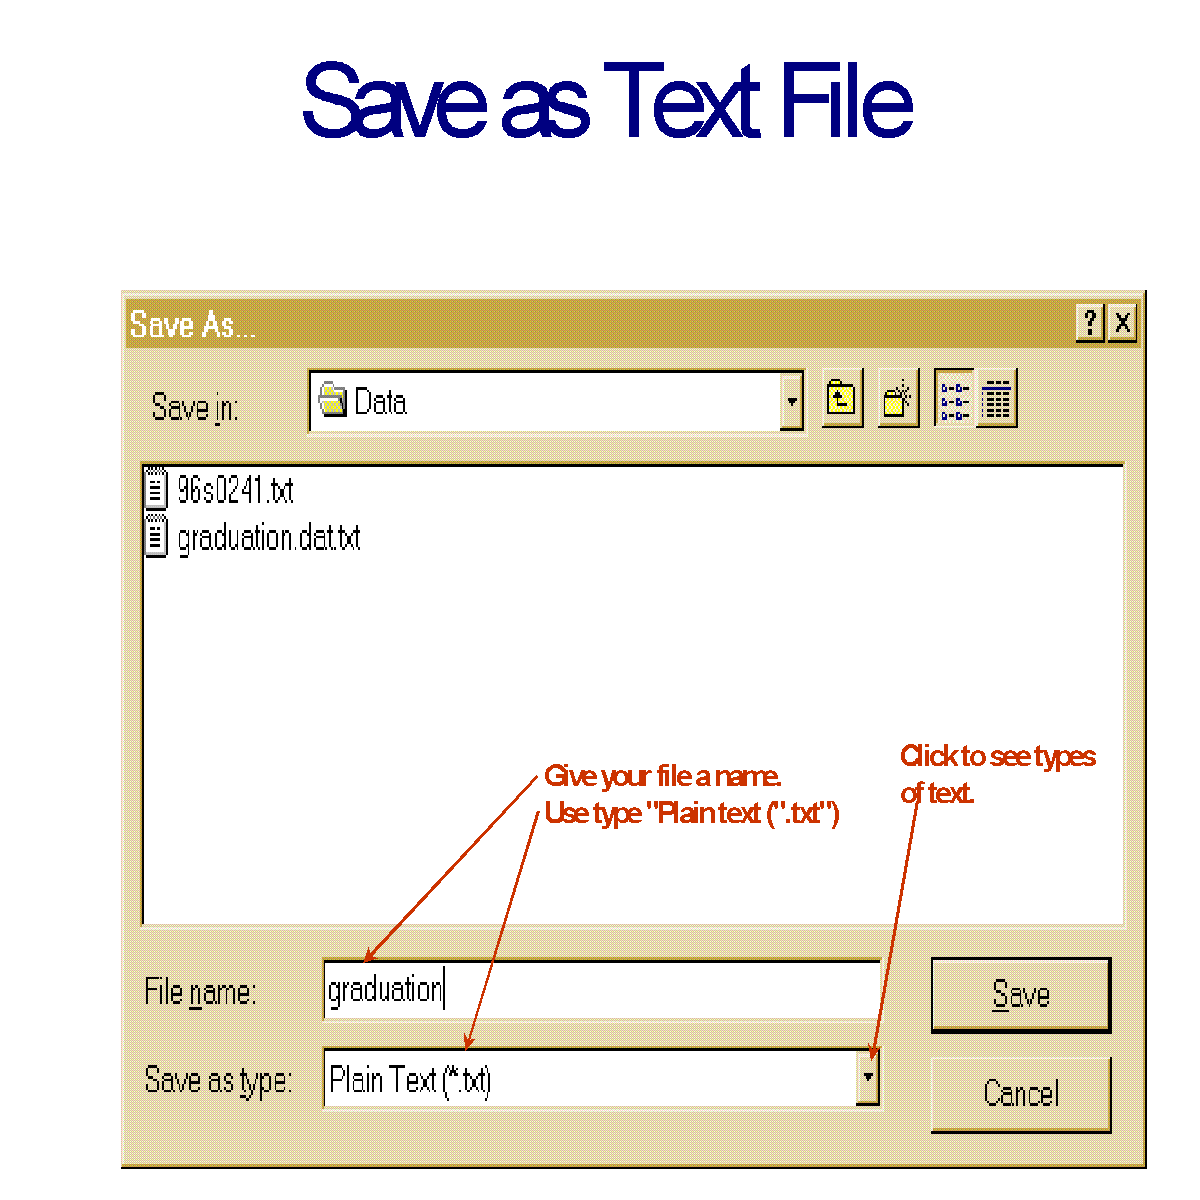
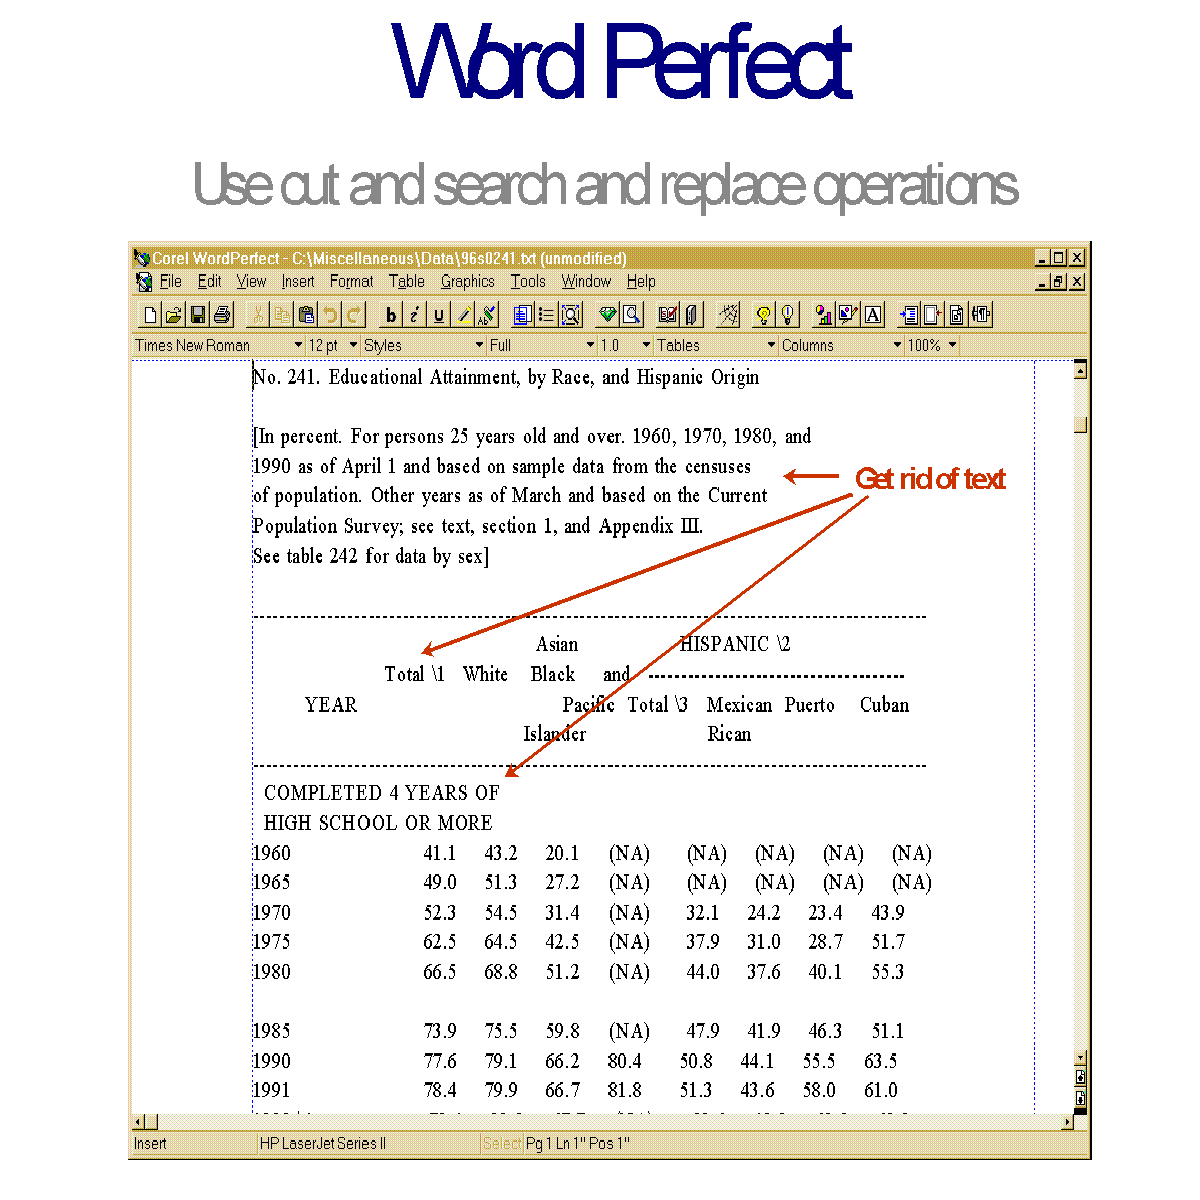
- "DATA CLEANING:"
- Statistical programs cannot process textual information so use a word processor to
strip out non-numeric information.
- Cut and delete operations
- See Figures 5
- An aside for key terms
- Units of analysis: the entities being "measured"
- Variables: attributes or characteristics of units of analysis.
- Types of variables:
- Quantitative or numerical measures
- Qualitative: categories or labels
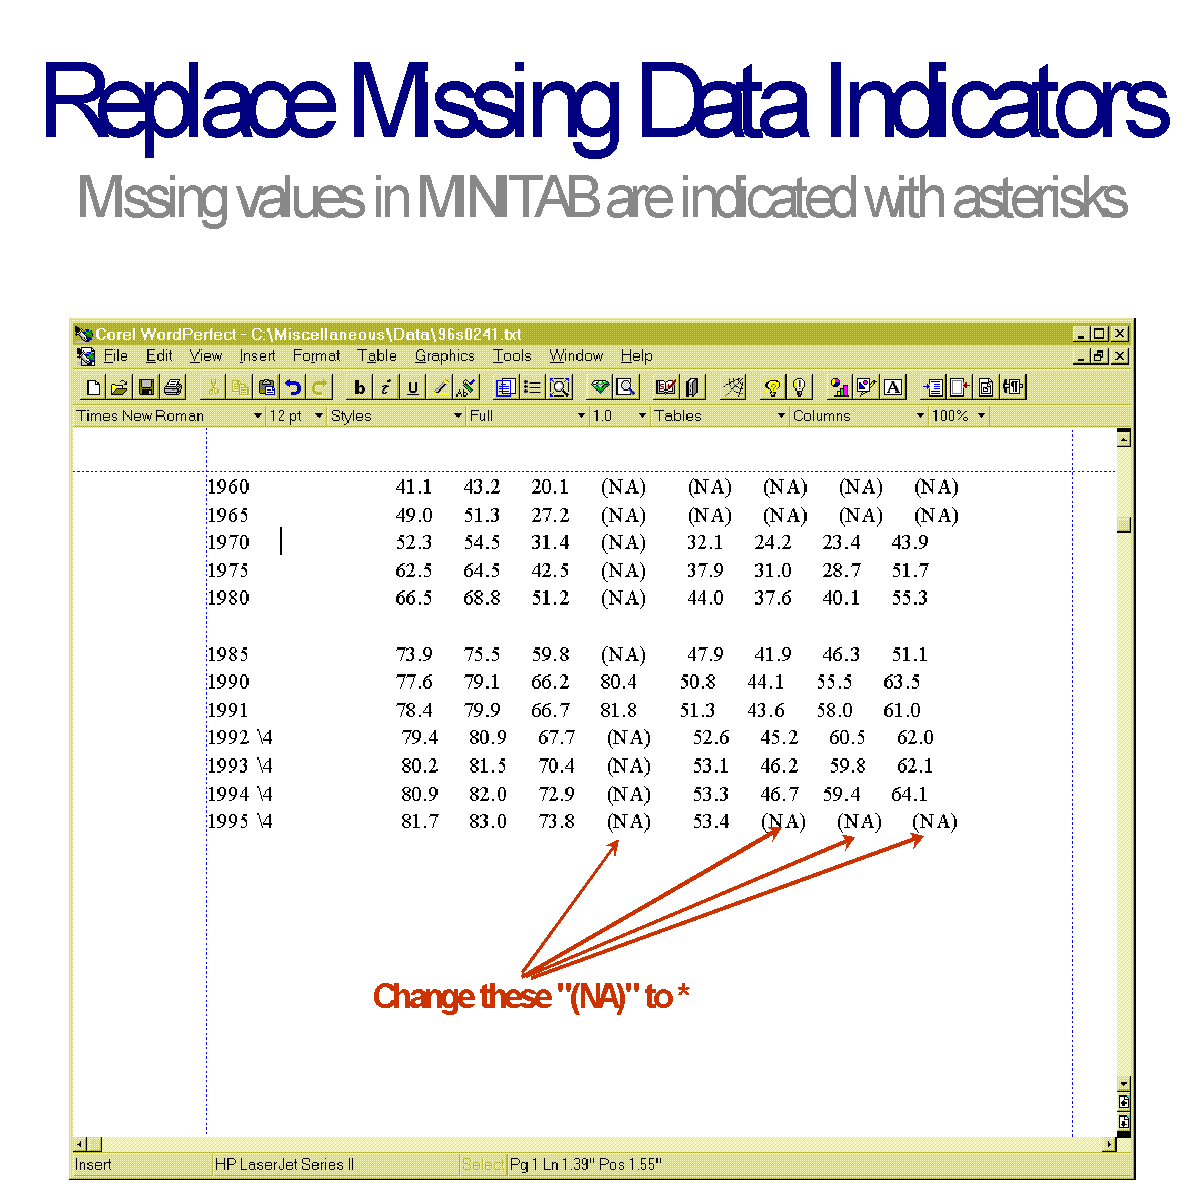
- Missing values: measurements or classifications are frequently not
available for all units. They are assigned missing value "codes."
- The codes indicate that the case or unit should not be included in
the statistical analysis.
- Codes must be convert to a symbol the particular program
"understands."
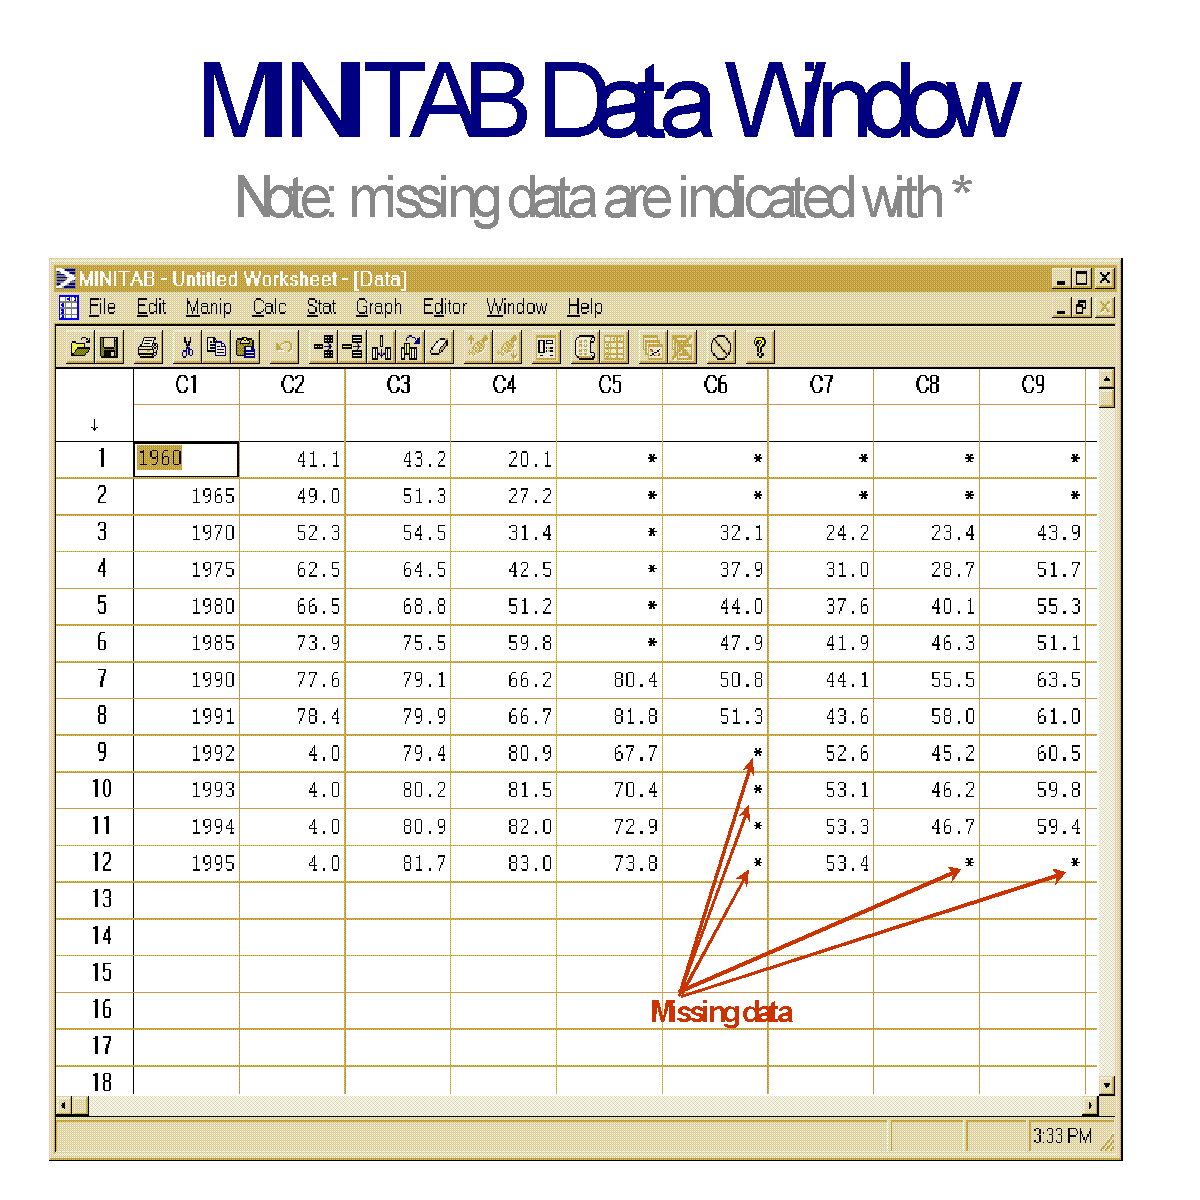
- MINITAB recognizes the asterisk as a missing value: any
observation or case that has a "*" in a data field will be excluded
from the analysis.
- Note: SPSS uses a period as a symbol or the user can
designate some value(s) as missing.
- Be aware of missing values and how a program handles
them.
- Hence convert textual indicators of missing information to
asterisks.
- See Figure 6.
- Use a word processor's search (or find) and replace operators to change text to
missing value indicator.
- Save the data a plain or text file.
- SPSS and MINITAB only "read" (i.e., process) numeric information.
- So numbers must be stored in a format that these programs can recognize.
- No statistical program will recognize a file of information that is
stored in, say, Word or Word Perfect format.
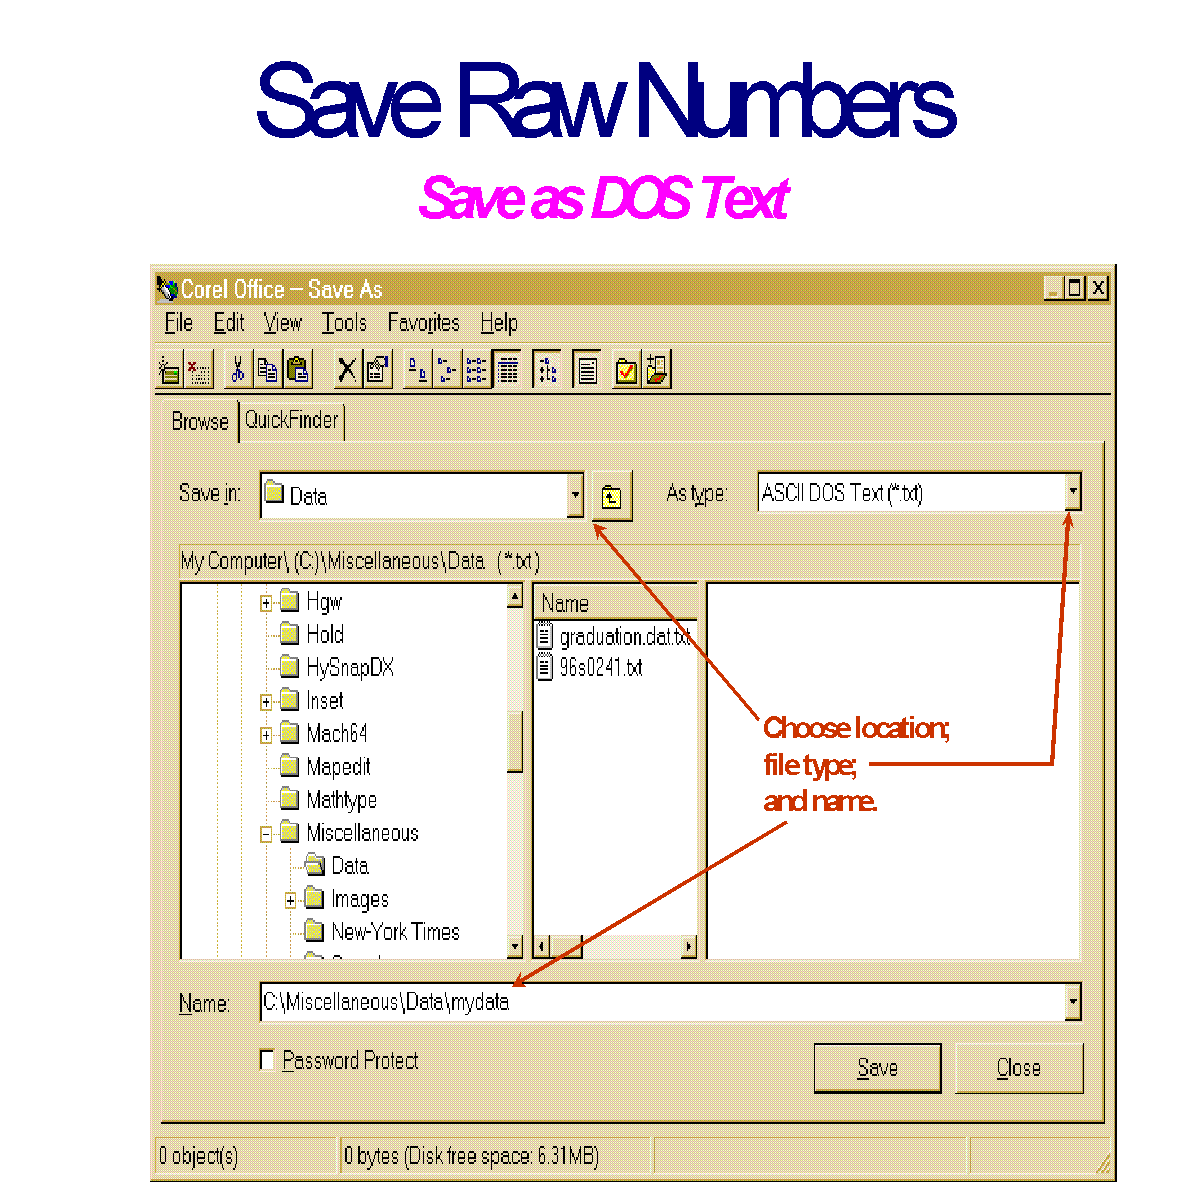
- Consequently, after removing text and changing missing data characters to
the missing value code, store the file as a DOS text file.
- See Figure 7.
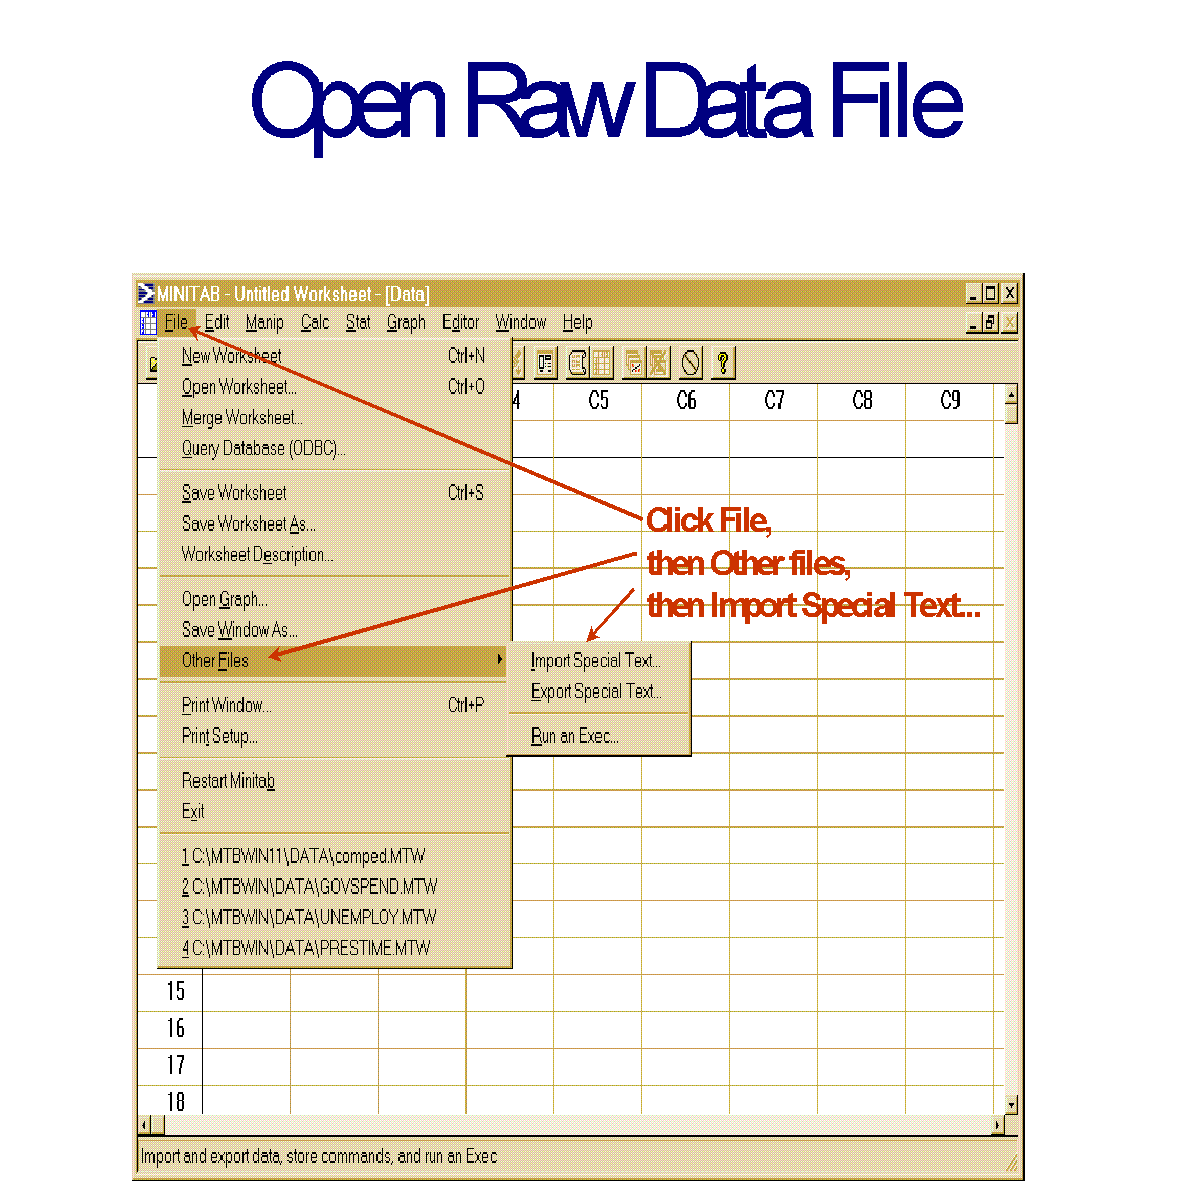
- READING PLAIN OR RAW DATA INTO MINITAB:
- Two methods for entering data into MINITAB (or SPSS):
- Type numbers directly into data window, as discussed last time.
- "Read" previously stored data file.
- Folders and files
- Data on a hard drive or diskette are stored in folders and sub-folders under
specific file names that indicate the content and type of data.
- Start MINITAB
- Click File and then Other Files
- Click Import Special Text
- NOTE: WITH STUDENT VERSION OF MINITAB
CLICK ON IMPORT ASCII FILES
- See Figure 8.
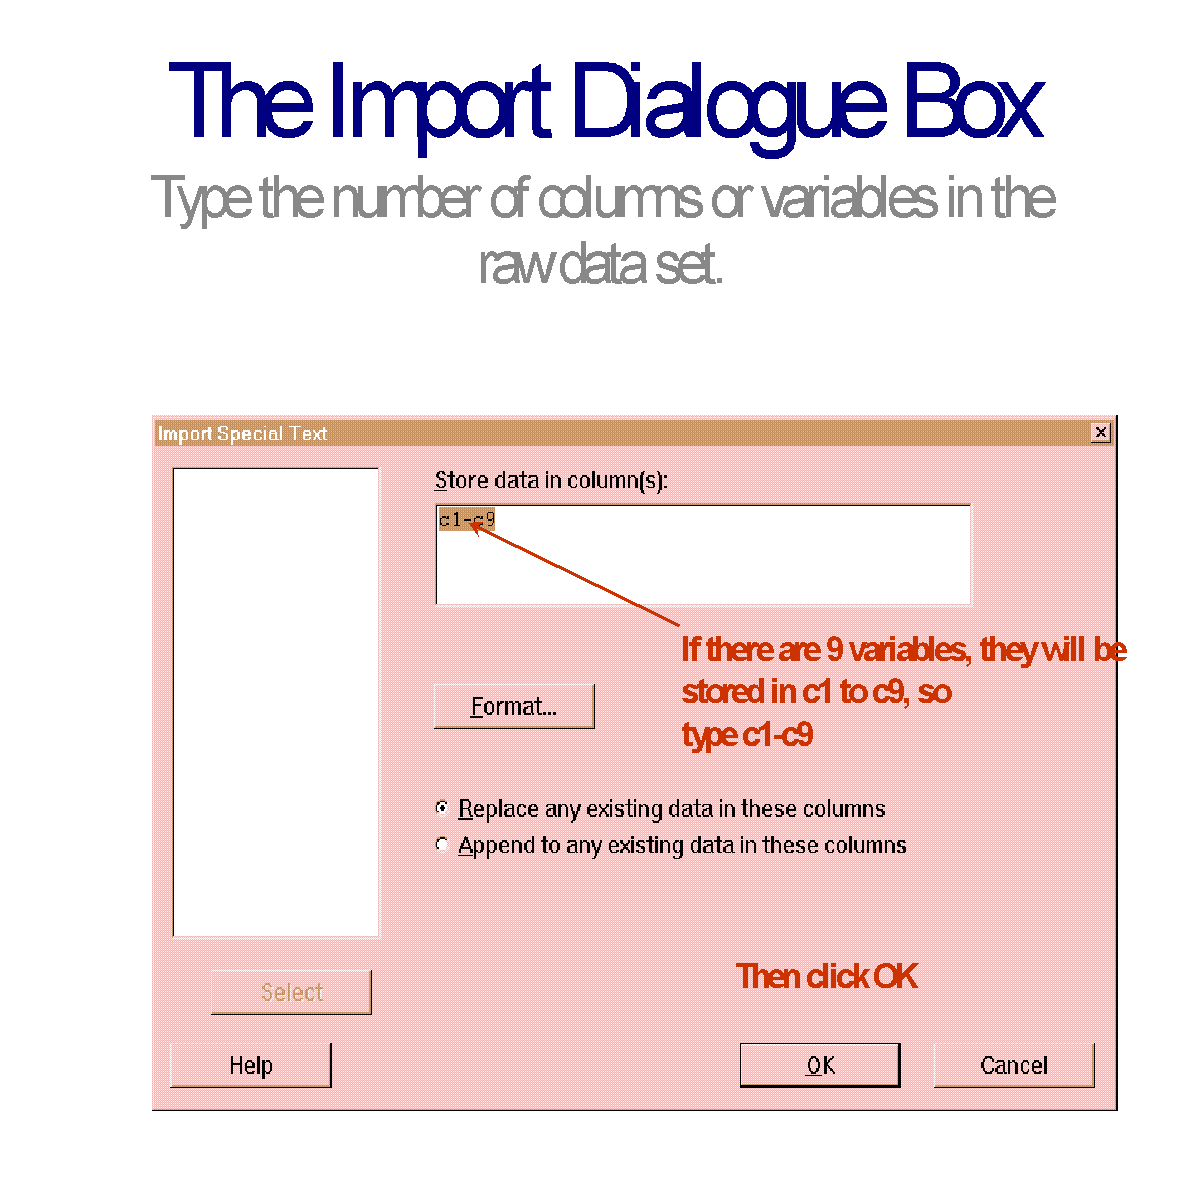
- Import dialogue box.
- Data are stored in MINITAB in columns.
- You must therefore know how many columns will be "imported" or read
from the disk.
- The example data set consists of 9 columns of data.
- So in Store data in column(s): type c1-c9
- Click OK
- See Figure 9.
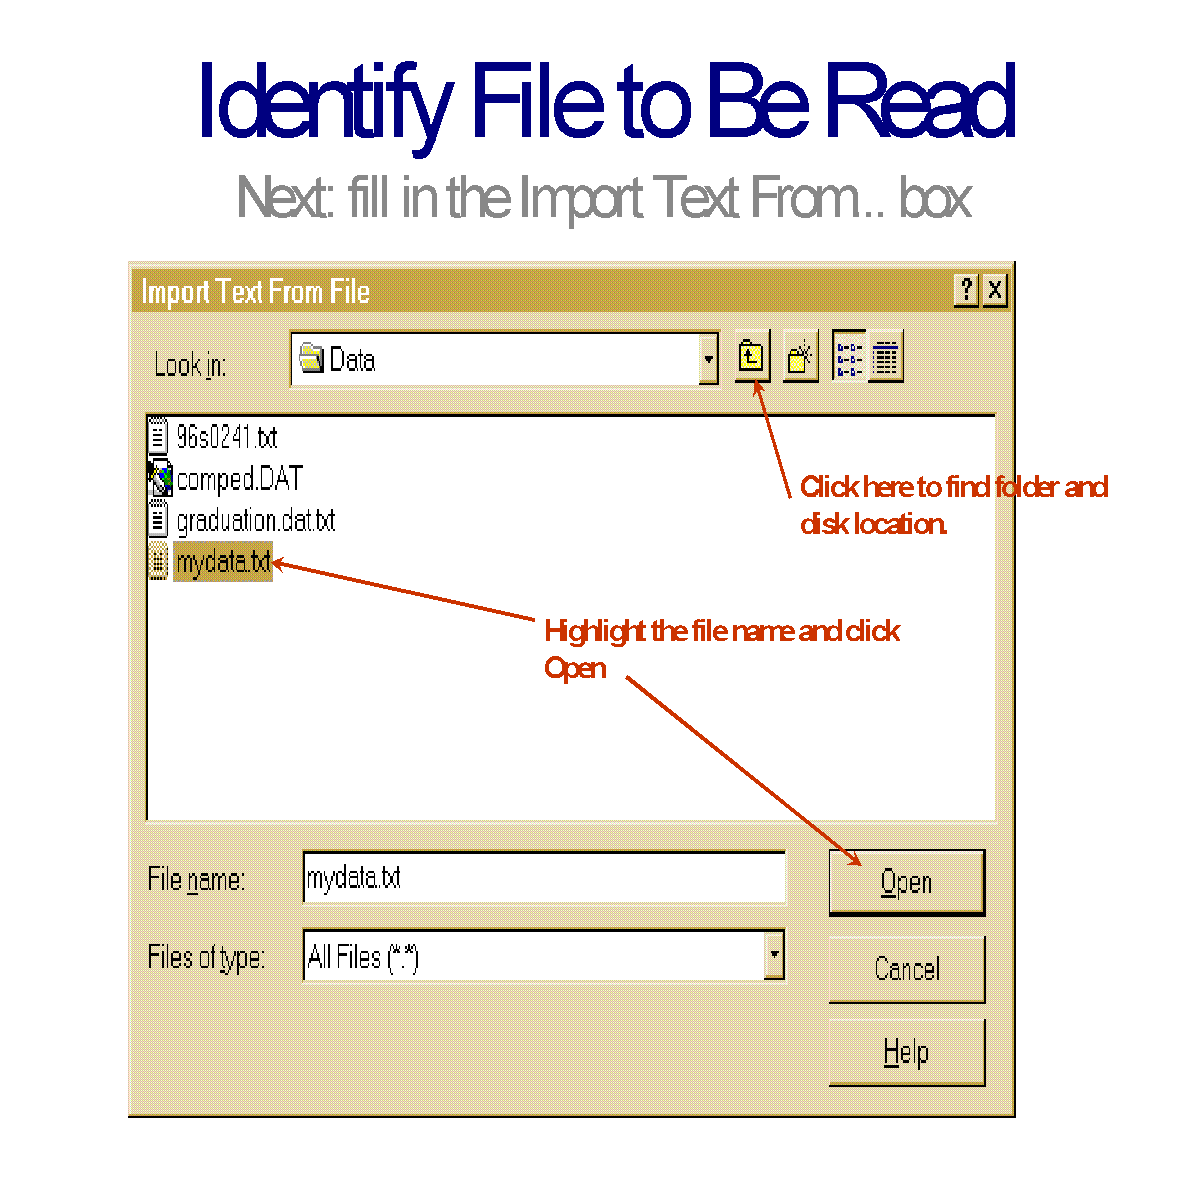
- Next tell the program where the data are stored. That is, indicate the disk,
folder(s), and name.
- See Figure 10.
- In this case the data are stored on the hard drive (c:) in a folder
called Data under the name mydata.txt
- After identifying the location click OPEN
- The Data window
- See Figure 11 which shows how data are stored.
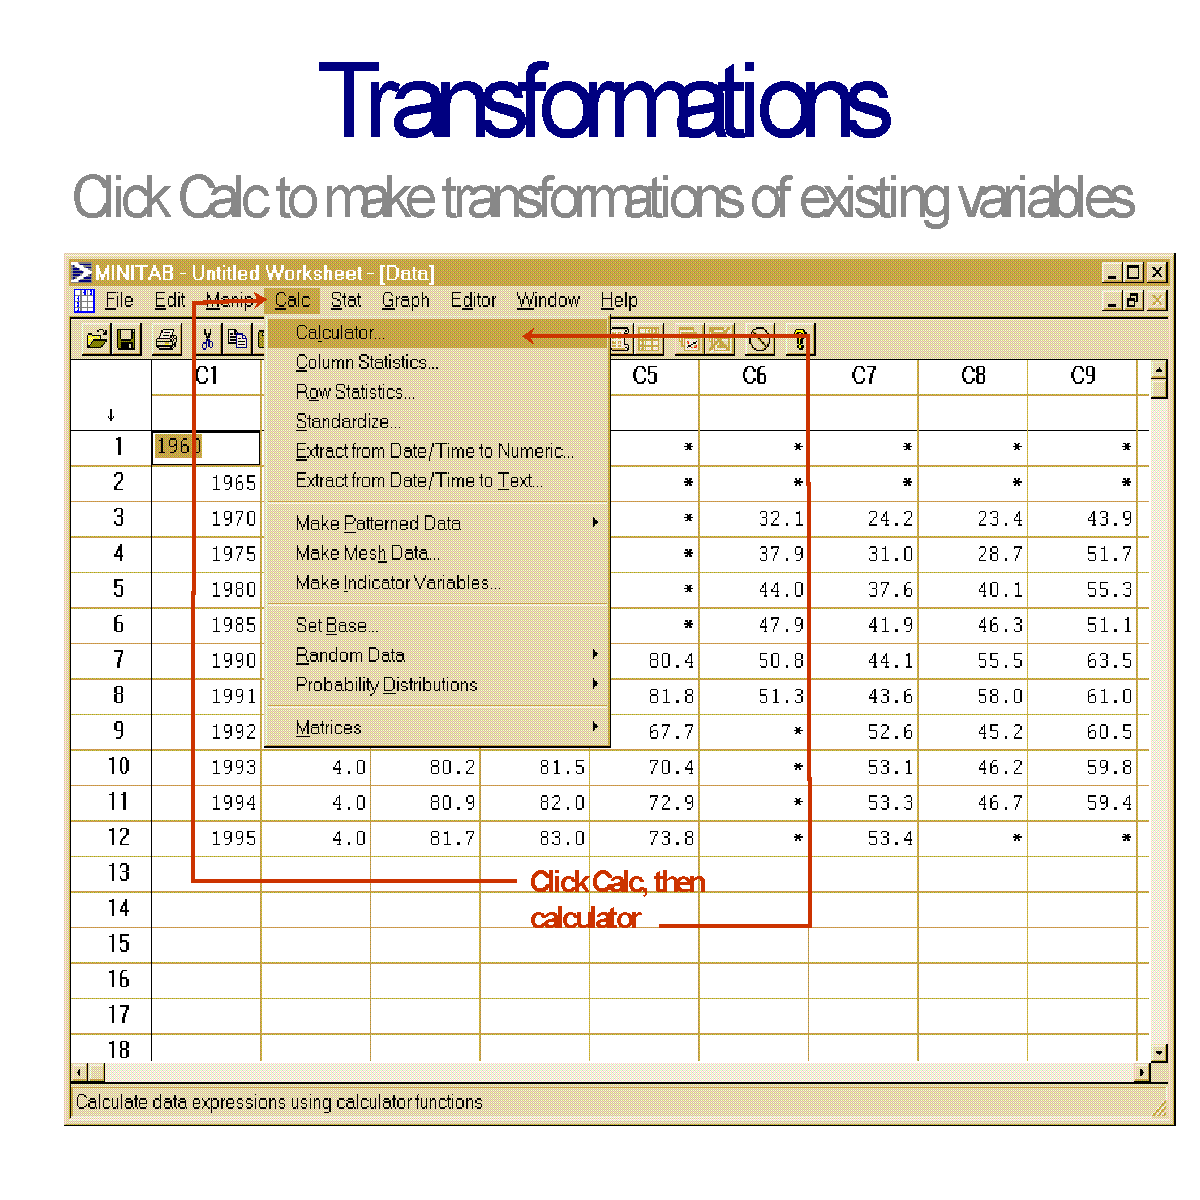
- CREATING A NEW VARIABLE:
- We want to examine the difference in white and black graduation from high school
rates for different time periods. But the original data set does not contain a
measure of the difference in rates. So we need to use the calculation features of
MINITAB (or the transformation procedures in SPSS) to create a variable:
- Given the present data set this translates to
- Click Calc and then Calculator
- NOTE: WITH STUDENT VERSION CLICK ON CALC AND
MATHEMATICAL EXPRESSIONS
- See Figure 12.
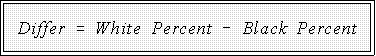
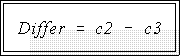
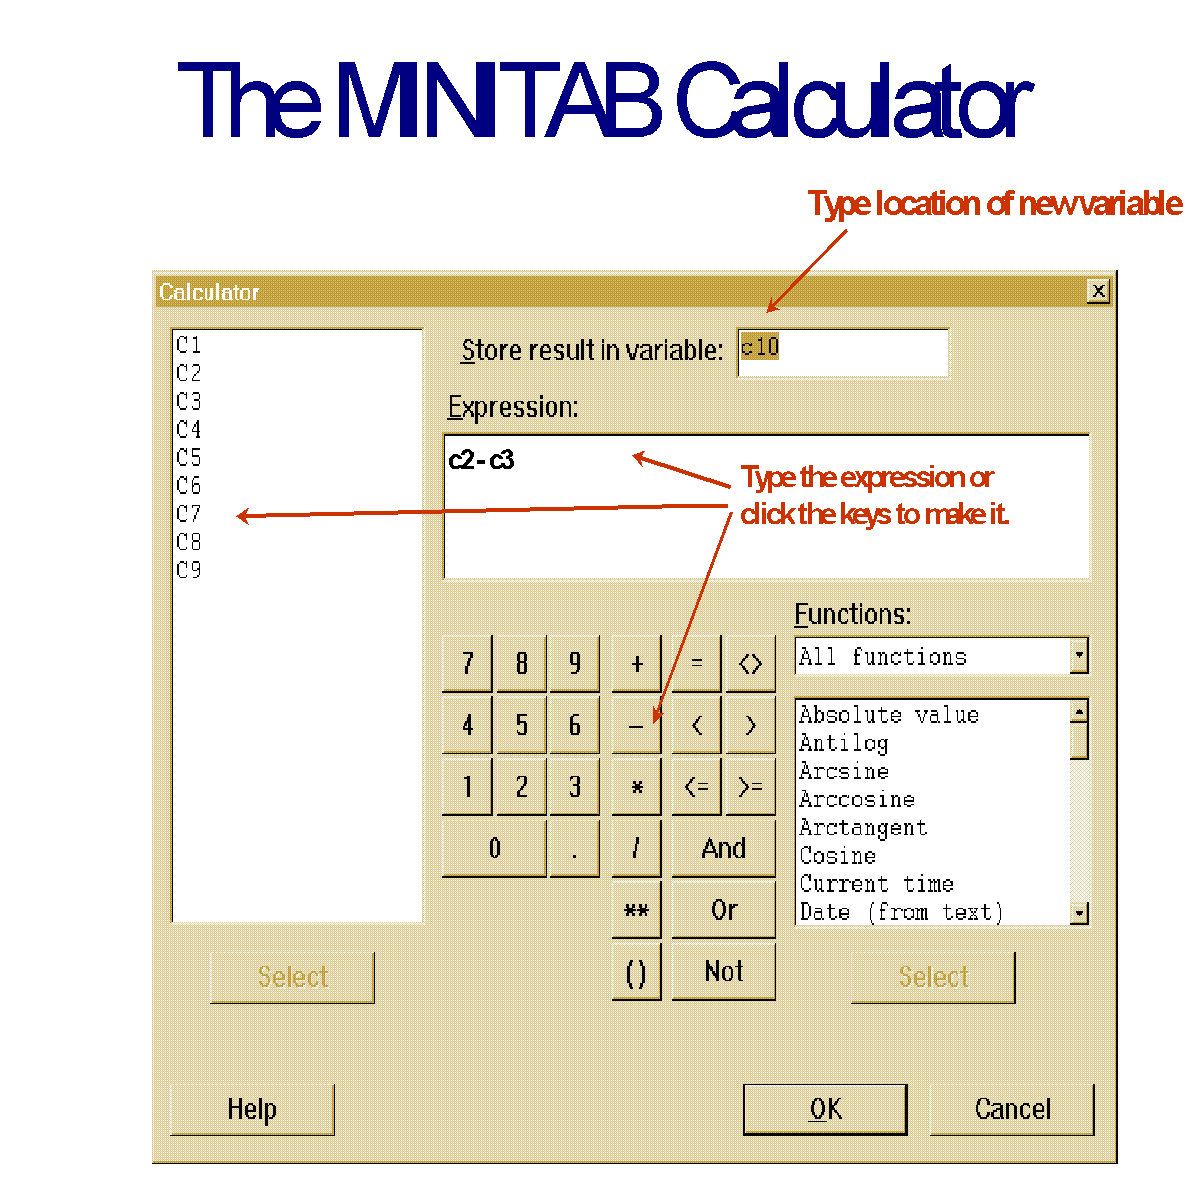
- The new variable, Differ, needs to be stored somewhere so type in the Store
result in variable box: c10
- Or, type a short name and the program will automatically assign a storage
location for the new variable.
- See Figure 13.
- In the Expression box type the equation.
- Manually type the expression or use the pointer (arrow) and mouse to
"click" in the equation. That is, highlight c2 by moving the pointer to it,
then Select; click the minus sign; highlight c3 and click Select.
- See Figure 13 again.
- Click OK
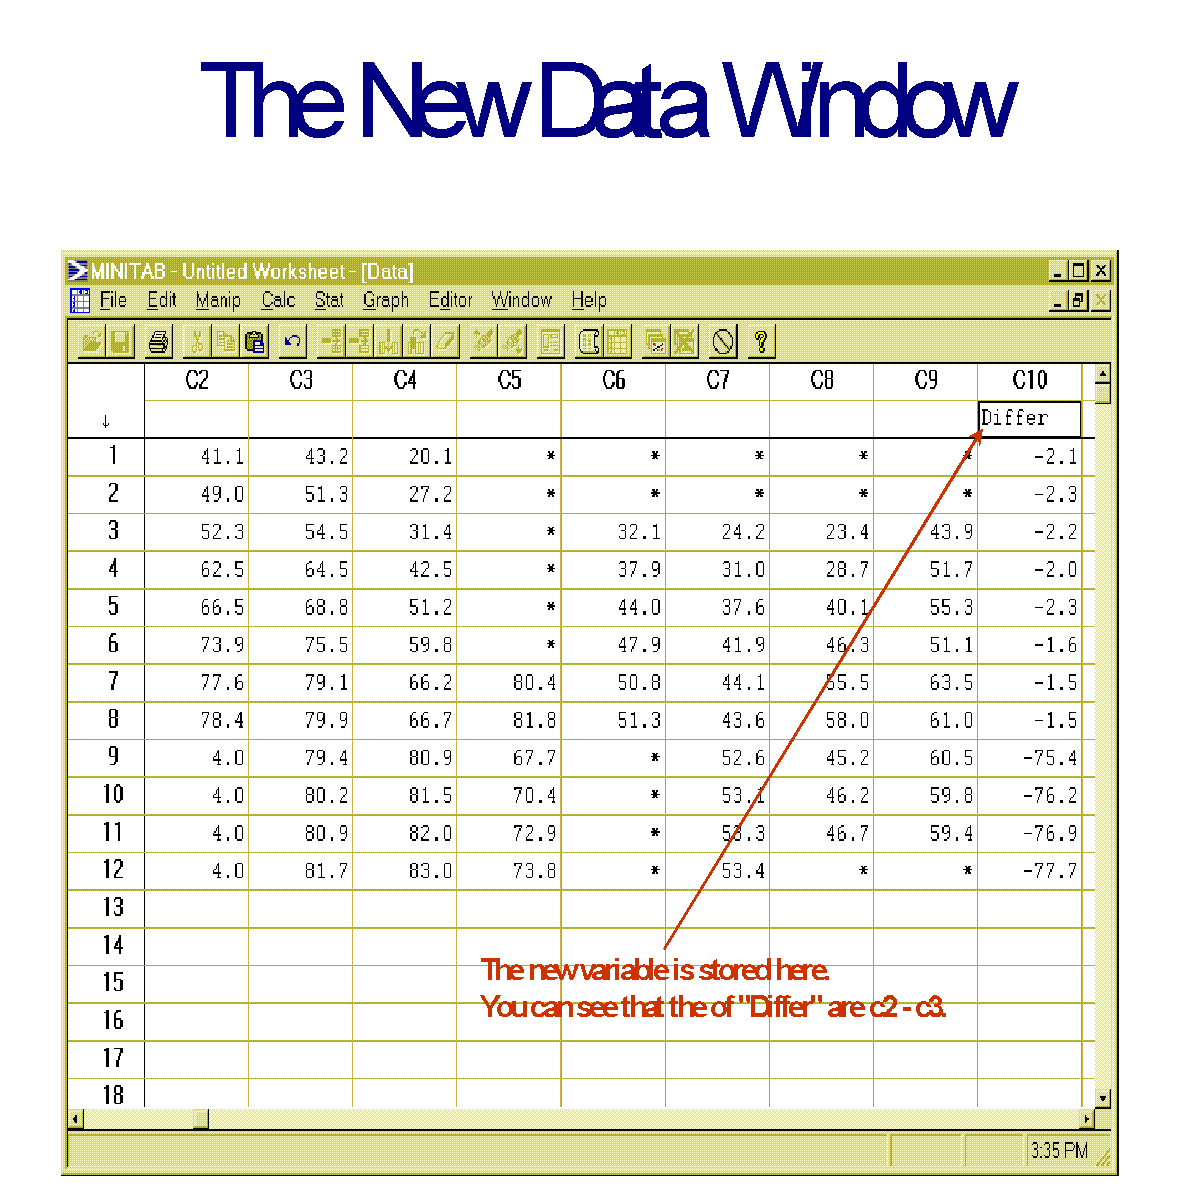
- Look at the data window. The new variable has been stored in column 10.
- I previously (off screen) added the label "Differ"
- See Figure 14.
- DATA ANALYSIS:
- Time series data
- The "difference scores" pertain to time periods. That is, the unit of analysis
is "year."
- Measurements collected at different time periods are called time series.
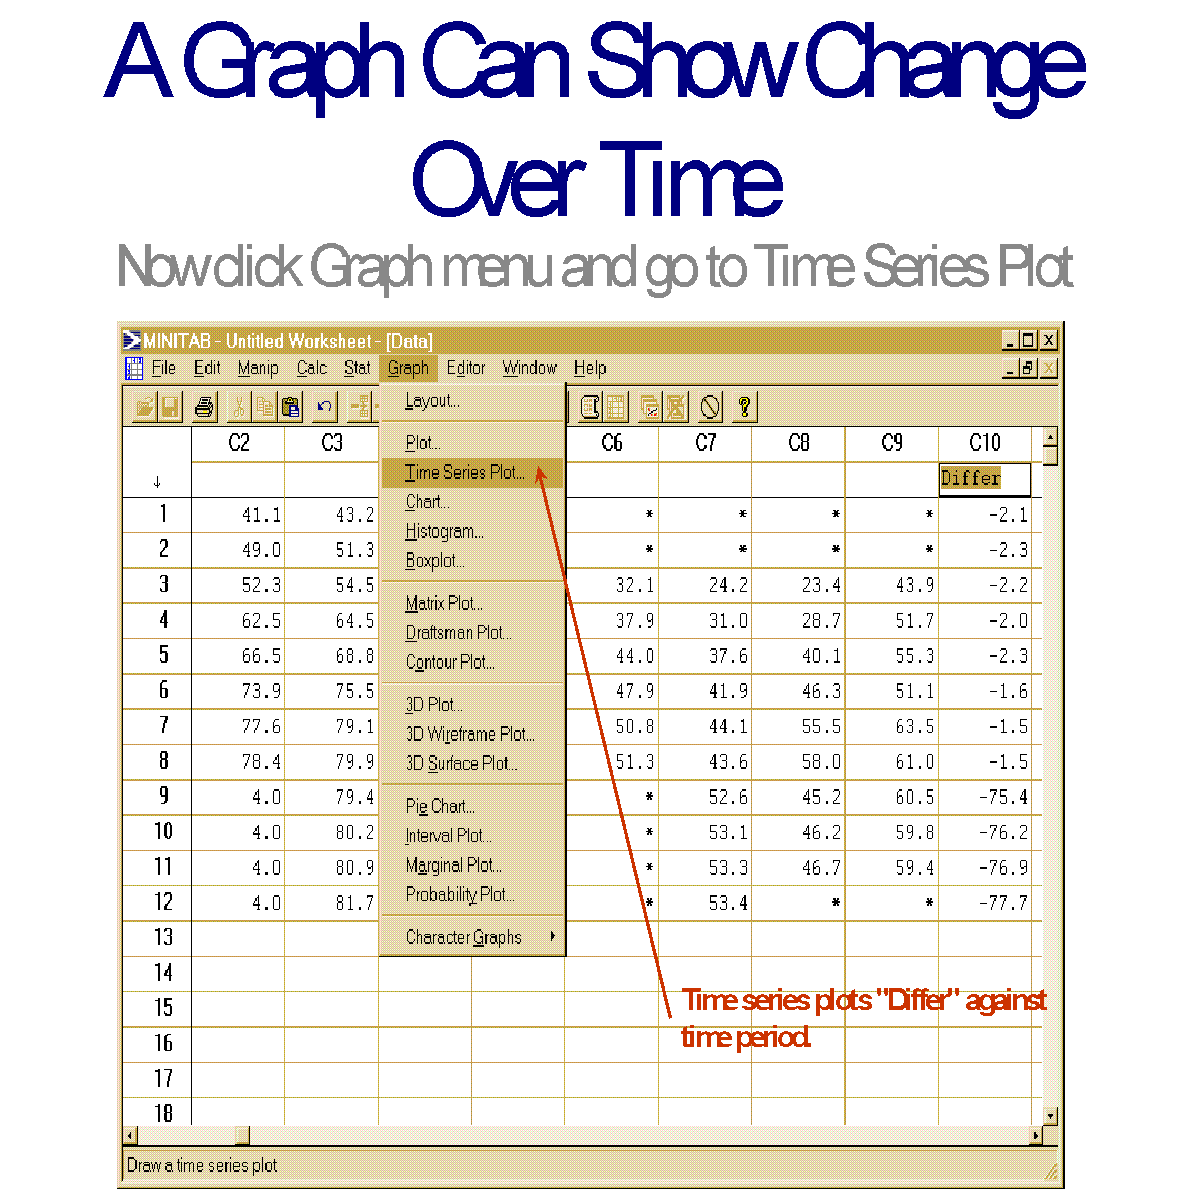
- Time series can easily be plotted with the Time Series Plot
- See Figure 15.
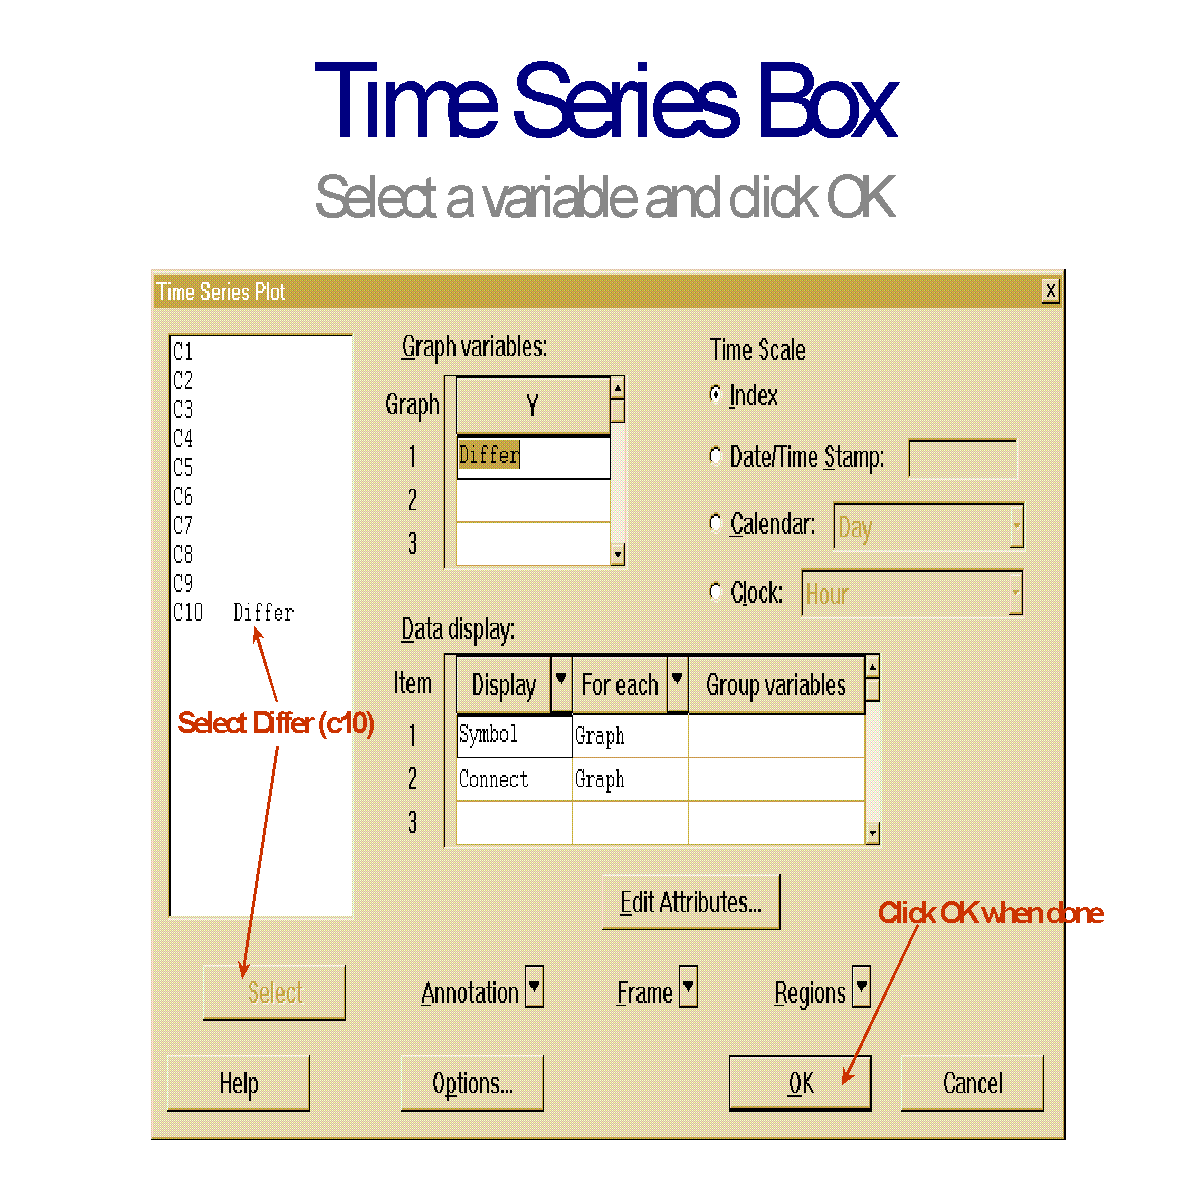
- Select Differ (or c10) from the variable list and click OK.
- See Figure 16.
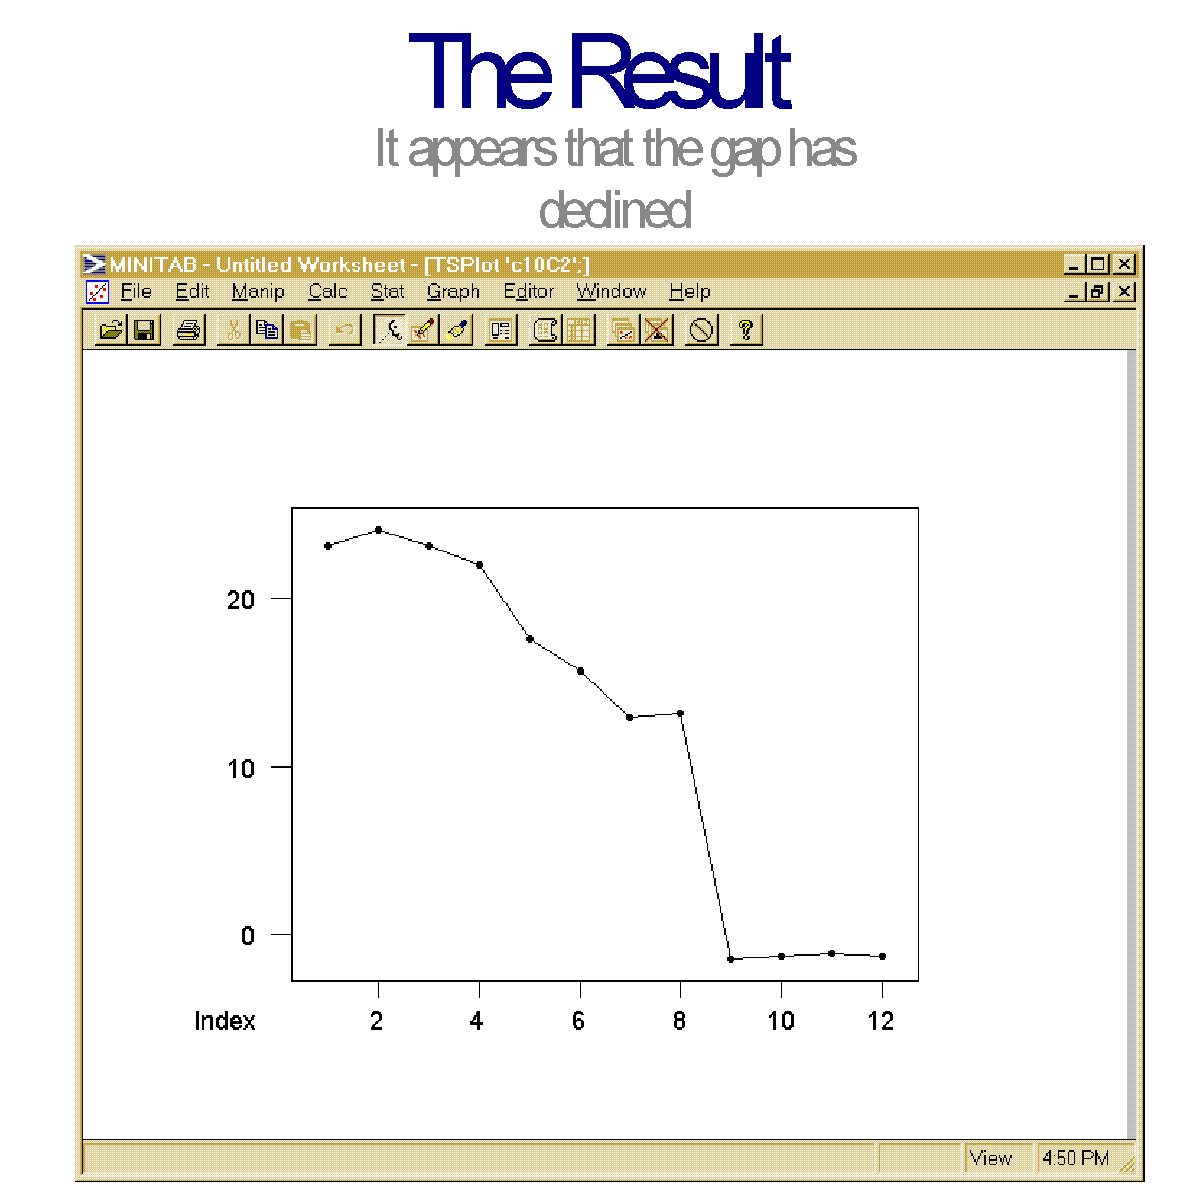
- The time series plot appears in Figure 17.
- What is your interpretation?
- DATA STRUCTURES AND VARIABLES:
- First, recall that "unit of analysis" refers to the level or kind of "thing" being
measured or studied.
- Research might involve individuals or perhaps counties or provinces or
countries.
- In these examples the units of analysis are "individuals," "counties,"
"provinces," and "countries" respectively.
- Variables are properties or attributes of units of analysis.
- The percent of children who watch 5 or more hours of television daily, for
instance, is a variable because different units of analysis (i.e., countries)
have different levels or amounts of this "property."
- Similarly, the "homicide rate" is a variable because it too is a characteristic
of an area like an American state.
- Many of the problems discussed in Class 1 involve assertions or statements or
about variables
- Note: a variable is attribute or characteristic or trait that different units exhibit in
different amounts or degrees or levels. Do not confuse a variable with a specific
amount. Age is a variable; 25 is a particular value of the variable. Per capita
income is a variable; $10,000 is a particular value of that variable.
- Types of variables:
- Numeric (quantitative)
- Natural numbers with or without a meaningful zero point
- Examples: age, income, temperature, number of highway fatalities
per year per 1 million car miles driven; percent of children who
watch more than 5 hours of television; years of education.
- Categorical (qualitative):
- Nominal: measurement consists of assign units or cases to
categories.
- Examples: Gender, political party affliation, occupation,
region of country
- "Values" of the variable are merely labels that do not
indicate amount or quantity.
- Ordinal: categories can be "ranked" but "distances" between levels
or categories are not fixed or even known.
- Example: level of interest in government categorized as
"high," "medium," and "low."
- A person in the "medium" category is not necessarily twice
as interested as someone ranked "low."
- Variables can also be termed "dependent" or "independent"
- Mathematics test scores would probably be called dependent
because we think of it as depending on or being caused by other
factors such as amount of time studying or family background.
- On the other hand, per capita income or the level of development of
nations could be called independent or "explanatory" because we
might hypothesize that it "explains," "causes," or some other sense
account for variation on a dependent variable.
- Sometimes the distinction between dependent and independent variables is
arbitrary.
- Variation: The fundamental concept of statistics is variation: the amount or
magnitude of differences on a variable.
- Variation may be large or small.
- A MAJOR GOAL OF SOCIAL SCIENCE IS TO EXPLAIN
VARIATION
- This is normally done by using one or more independent variables
to explain a dependent variable.
- There is thus a connection between statistical "explanation" and
"substantive understanding and answers to problems.
- NEXT TIME:
- Data structures
- Tools for summarizing and displaying data
 Go to Statistics main page
Go
to H. T. Reynolds page.
Copyright © 1997 H. T. Reynolds