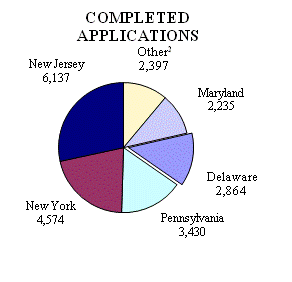
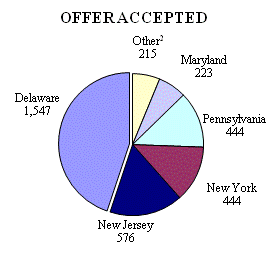
DISTRIBUTION OF COMPLETED ADMISSIONS APPLICATIONS AND ACCEPTED OFFERS
FIRST-TIME FRESHMEN FROM SELECT REGIONAL STATES
Fall 2010
| STATE | COMPLETED APPLICATIONS |
% OF TOTAL1 |
STATE | OFFER ACCEPTED |
% OF TOTAL1 |
|
|---|---|---|---|---|---|---|
| New Jersey | 6,137 | 28.4% | DELAWARE | 1,547 | 44.9% | |
| New York | 4,574 | 21.1% | New Jersey | 576 | 16.7% | |
| Pennsylvania | 3,430 | 15.9% | New York | 444 | 12.9% | |
| DELAWARE | 2,864 | 13.2% | Pennsylvania | 444 | 12.9% | |
| Maryland | 2,235 | 10.3% | Maryland | 223 | 6.5% | |
| Massachusetts | 954 | 4.4% | Connecticut | 87 | 2.5% | |
| Connecticut | 906 | 4.2% | Massachusetts | 81 | 2.3% | |
| Virginia | 470 | 2.2% | Virginia | 36 | 1.0% | |
| District of Columbia | 67 | 0.3% | District of Columbia | 11 | 0.3% | |
| TOTAL1 | 21,637 | 100.0% | TOTAL1 | 3,449 | 100.0% |


1Total refers to applications and accepted offers from these nine states only.
2Other includes Connecticut, Massachusetts, Virginia, and the District of Columbia.
Source: Official ADM Extract,
Office of Institutional Research/UDEW