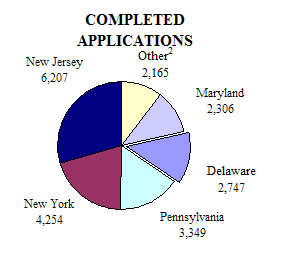
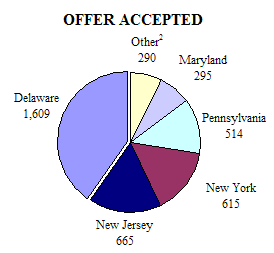
DISTRIBUTION OF COMPLETED ADMISSIONS APPLICATIONS AND ACCEPTED OFFERS
FIRST-TIME FRESHMEN FROM SELECT REGIONAL STATES
Fall 2009
| STATE | COMPLETED APPLICATIONS |
% OF TOTAL1 |
STATE | OFFER ACCEPTED |
% OF TOTAL1 |
|
|---|---|---|---|---|---|---|
| New Jersey | 6,207 | 29.5% | DELAWARE | 1,609 | 40.3% | |
| New York | 4,254 | 20.2% | New Jersey | 665 | 16.7% | |
| Pennsylvania | 3,349 | 15.9% | New York | 615 | 15.4% | |
| DELAWARE | 2,747 | 13.1% | Pennsylvania | 514 | 12.9% | |
| Maryland | 2,306 | 11.0% | Maryland | 295 | 7.4% | |
| Massachusetts | 812 | 3.9% | Connecticut | 113 | 2.8% | |
| Connecticut | 786 | 3.7% | Massachusetts | 111 | 2.8% | |
| Virginia | 467 | 2.2% | Virginia | 58 | 1.5% | |
| District of Columbia | 100 | 0.5% | District of Columbia | 8 | 0.2% | |
| TOTAL1 | 21,028 | 100.0% | TOTAL1 | 3,988 | 100.0% |


1Total refers to applications and accepted offers from these nine states only.
2Other includes Connecticut, Massachusetts, Virginia, and the District of Columbia.
Source: Office of Institutional Research/UDEW