sas &
Then type the following lines in the Program
Editor. If you make a mistake, backspace over the error and
retype.
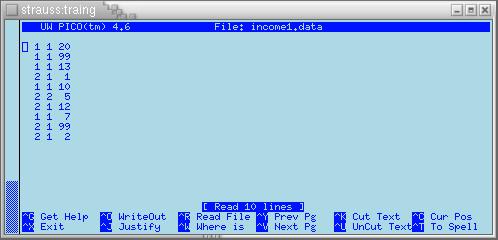
Note: The first field of numbers holds values for the variable gender, the second field holds values for race, and the third field holds values for persinc. Be sure the data for gender are in column 3, the data for race are in column 5, and the data for persinc are right-justified in columns 7 and 8.
These alignments are not important for the current exercise, but are needed for a later exercise.
Before submitting this program, check the help menu for the Program Editor -- . Go to the tab. Notice two options: (1) Clear text on submit and (2) Split lines on carriage return. You may want to select the 1st one of these two and deselect the 2nd.
Deselecting "Clear text on submit" prevents the
Program Editor from clearing when you submit
a job. And selecting "Split lines on a carriage return" instructs
the Program Editor to insert a line after
the current line when you press the
 key.
key.
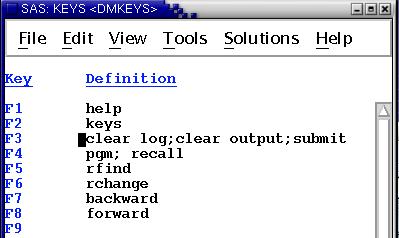
Also, it's worth repeating that you can set the F3 key to clear the Log Window and Output Window each time you use the F3 key to submit a job --
Now run the program and view the results -- press the F3 key or select from the menus. You can activate any window by clicking on it with the mouse or by selecting the View menu and selecting the window you wish to view. Results are displayed in the Log and Output windows.
If you made no typing errors, output from the means procedure is displayed in the Output Window.If you have no output check the Log Window for errors. You can move the windows so that both the Log Window and Program Editor can be viewed side by side. Notice the color coding of the instructions in the Program Editor. The colors help you to spot problems: Blue for SAS commands, black for options and green for numeric values and character strings. If you can't find the mistake, I will come around to help you. (Note: If you did not deselect "Clear text on submit," recall the program by pressing the F4 key.)
The Log Window lists the commands in the Program Editor and gives several pieces of information, identified by "NOTE:" For example, it tells how many cases are written to the SAS data set, and how many cases were read by the means procedure. The Output Window lists output from SAS procedures. This program reads a few cases from inside the Program Editor into a temporary SAS data set called inc. This SAS data set is read by the means procedure to produce means, standard deviations, etc. Unless instructed otherwise, SAS procedures always read the most recently created SAS data set. The function of each statement is --| options ls=80; | Restrict the output linesize to 80 characters or less per line |
| data inc; | Start the data step and give the name inc to the temporary SAS data set |
| input gender race persinc; | Input data into three variables: gender, race, and persinc |
| if persinc > 23 then persinc=.; | Set persinc (personal income) to missing if it is greater than 23 |
| datalines; | Indicate that data are to follow (data end with a semicolon on a line by itself) |
| run; | Indicate the end of the data step, instruct SAS to run it (optional statement, but recommended) |
| title ...; | Places a title at the top of each page in the output. This is useful for negotiating through output after you have accumulated a lot of it. |
| proc means; | Calculate descriptive statistics for all variables |
| run; | Indicate the end of the proc step and instruct SAS to run it (optional statement, but recommended) |
1 1 1 2 1 2 2 1 2 2
Save the file by pressing ^X and responding
to the prompts with the letter y then the key.
Next, edit the commands in the Program
Editor by taking out the data lines and inserting an infile statement. To delete a block of lines,
place dd in the prefix beside the first line
to be deleted and another dd beside the last
line to be deleted, then press
. To insert a line,
place the letter i in the prefix area above
where you want to insert the line. (See an image
of the prefix commands.) Note: If you set "Split lines on a carriage return," you
can add a line by pressing the
key at the end of the line above where the new line is to be inserted.
Finally, change "Example 1" in the title statement to "Example 2". The result should look like --

To avoid extra typing, save this file; call it income2.sas. Click and type the file name in the dialog.
Now run the program and view the results -- press the F3 key or select from the menus. By default, SAS output to the saslog is appended to existing content of the Log Window, and output from procedures is appended to existing content of the Output Window.
Now the Results Window may be useful. Click the + beside the two "Means:" entries and widen the window so you can read the entire titles, so that your window looks like --
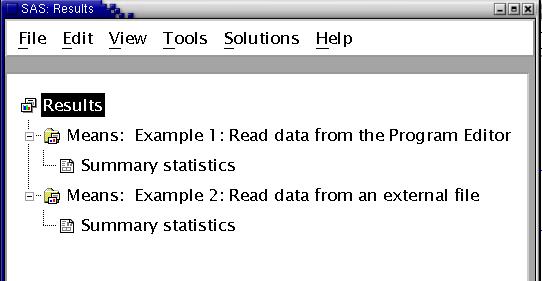
Right click the output you want to view (here "Summary statistics") and release on . The Output Window scrolls to the output you select. Note that the descriptive statistics reported by the means procedure are exactly the same for both sets of output.
This exercise repeates the previous two but the input statement now designates exact column(s) spanned by each variable. Type the following lines into the Program Editor --
This exercise explains why the 1st Exercise instructs you to be sure the data reside in fixed locations.
Also save this file, and call it income3.sas. Click and type the file name in the dialog.
The numbers that follow each of the variable names, gender, race, and persinc, indicate the columns spanned by the values for each variable. Gender starts in column 3 and ends in column 3. Race starts and ends in column 5, but persinc spans two columns; it begins in column 7 and ends in column 8. (Column here used in the first sense.)
The spacing of the column-location numbers in the Program Editor is done for readablity. Only one space is required between the variable name and the columns spanned, and it is not necessary to start each variable on a new line. But these formating conventions do make the program easy to read and facilitate spotting errors.
Once again run the program and view the results -- press the F3 key or select from the menus. SAS output to the saslog again is appended to existing content of the Log Window, and output from procedures again is appended to existing content of the Output Window. -- unless you edited the function of the F3 key so it clears both the log and output windows, and you submitted the job with the F3 key.
This exercise illustrates an additional SAS procedure, the print procedure. By default, it lists all variables and all observations to the Output Window. Select the output from the print procedure in the Results Window and observe that it lists back the numbers that were read from the input file, income1.data. But it reformts the listing for readability, including column headers, for example.----+----1----+----2----+----3----+----4----+----5----+----6----+----7-- 2004 17 2 1 22140-1 1 56739 60 1 8 2004 27 2 1 228-1-11 1 27432691 2 9 2004 3140 22 999 9905 2004 4148 21 875284713 2 2 8 2004 5136 21 14648425 2004 64 22 267316405 2 7 2004 7135 22 57551 605 2 4 2004 8299 22 33931 605 2 8 2004 9225 22 274325915 2 2004 10140 22 379348415 2 5
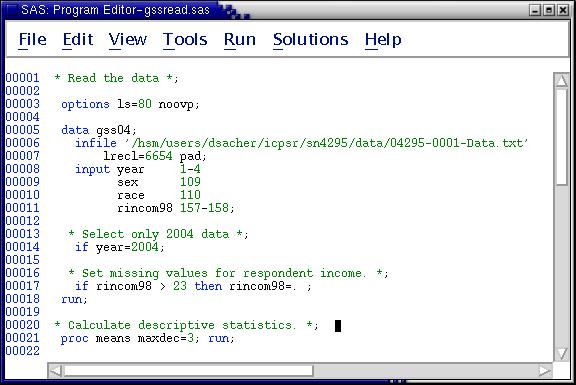
You can copy and paste the long file name from here:
'/hsm/users/dsacher/icpsr/sn4295/data/04295-0001-Data.txt'but not from the image.
Note: