IMSL Exponent Graphics: Instructions: Fortran (f77)
Setting the Exponent Graphics Working Environment
for Fortran (f77)
To use Exponent Graphics, you must set several UNIX environment variables.
These settings may adversely interact with settings needed for other UNIX
applications. The instructions below provide a strategy for
avoiding these interactions.
You start a new shell before you use
IMSL Exponent Graphics, modify the environment, run the programs, and exit the
shell before working with other software. You can start a new shell either
by opening a new window on an X terminal or by issuing the UNIX csh command.
These instructions assume that you are using
the C shell (csh), which is the default for University of Delaware users.
-
Start a new C shell by typing at the C shell prompt (%),
csh
-
Set the necessary environment variables for Exponent Graphics
by typing at the C shell prompt (%),
source /opt/lib/ipt_1.2/ipt/bin/iptsetup.csh
-
Add the location for the X11 load library by typing at the C shell
prompt (%),
setenv LD_LIBRARY_PATH /opt/X11R5/lib:${LD_LIBRARY_PATH}
-
Proceed to the compilation and execution steps
for your program.
Important warning: These instructions may redefine values
of environment variables you previously defined in your dotfiles (e.g.,
".localenv" file). The most likely variables to have been changed are
FC and FFLAGS. If these variables are not present in your dotfiles,
you will be fine. However, if you need to preserve your standard settings
for these variables when using IMSL Exponent Graphics, you must explicitly type
your modifications after following the above instructions. If you
need help or clarification, send e-mail to consult@udel.edu.
Compiling and Executing a Fortran (f77) Program
Having set up your working environment,
you can now compile and execute Exponent Graphics programs. When you're done
using the Exponent Graphics libraries, you should exit the current shell
(or close the current window), thereby returning to your previous working
environment.
-
Modify each Fortran source code file to fully specify the
/opt/lib/ipt_1.2/include
directory for any Exponent Graphics include file you use.
For example, at the top of the main program and each subprogram in which
the Exponent Graphics include file af.i is needed, add the line
include '/opt/lib/ipt_1.2/include/af.i'
-
Compile the Fortran program, linking to the Exponent Graphics link
library. If your Fortran program is stored in the file filename.f,
and you want to store the compiled version in a file named filename,
type
f77 -o filename filename.f
$LINK_EG
-
Run the program by typing,
filename
-
If prompted by the program for an output device, type 1 for
the X terminal screen, or type ? to see the other choices.
-
A complete Fortran example is presented below.
Fortran (f77) Example Programs
Several example programs are stored in the directory /opt/lib/ipt_1.2/examples/eg/application_f77 for Fortran.
The procedures above are illustrated next using modifications of the
Fortran program named confill1.f. You
can test whether you have set up your Exponent Graphics UNIX working environment
properly by following the instructions below.
-
Start a new shell by typing,
csh
or by opening a new window on the X terminal.
-
Set up the working environment as described above.
-
Use an editor (such as pico or vi) to create a file named example.f
containing the following lines. Note that the include statement
fully specifies the af.i include file.
      program main
      include '/opt/lib/ipt_1.2/include/af.i'
      integer    ncval, nx, ny
      parameter  (ncval=5, nx=11, ny=11)
c
      integer    istatus, iunit, new_plot
      real       ax, bx, ay, by, cfill_1
      external   cfill_1
c
      data iunit /0/
c
      ax   = -1.0
      bx   =  1.0
      ay   = -1.0
      by   =  1.0
      new_plot = 0
c                                  Setup the graphics database to
c                                  contour plot
      istatus = af_tgrid_contour_function_plot (cfill_1, nx, ny, ax, bx,
     &             ay, by, ncval,
     &             af_no_label,
     &             af_contour_fill,
     &             0)

      new_plot = af3_contour_fill(ncval, new_plot)
c                                  Draw the plot and close graphics
      call af3_plot (iunit, 0)
      end
c
c
      real function cfill_1 (x, y)
      real       x, y
      cfill_1 = 2.0 - (x*x + y*y)
      return
      end
Compile the program and store the compiled version in a file named
example by typing,
f77 -o example example.f $LINK_EG
Run the program by typing,
example
When prompted to specify an output device, type 1 to plot on
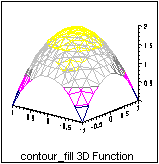
the X terminal. The following graph will appear in a new window.
 Click the mouse button in the new graph window to close. Now
you are prompted again to specify an output device, type 11
to create a landscape postscript file. You will see
the following error
 **** VNI-HOOPS error in ac_Pause has severity 3.
 **** There was an unexpected Hoops internal error -
 **** Nothing to wait for - no events are enabled
 **** Traceback =======>
 ****                   ac_Await_Event
 **** called from       ac_Await_Event
 **** called from       ac_Pause
 **** called from       ac3_plot
 **** called from       ac3_set
A new file is created called vnieg.ps
regardless of the above error. You can print this file to any
Postscript printer.
Again you are prompted to specify an output device, type q
to quit.
Instructions:Table of Contents
Main IMSL Exponent Graphics page
[Help Center]
Last modified: March 12, 1998.
This page maintained by
Anita Z. Hoover.
Copyright © University of Delaware 1997.
URL of this document:
http://www.udel.edu/debd/newtemplate/inst1.html


