Overview
Two benchmarks are provided for regions impacted by the 2011 Tohoku tsunami.
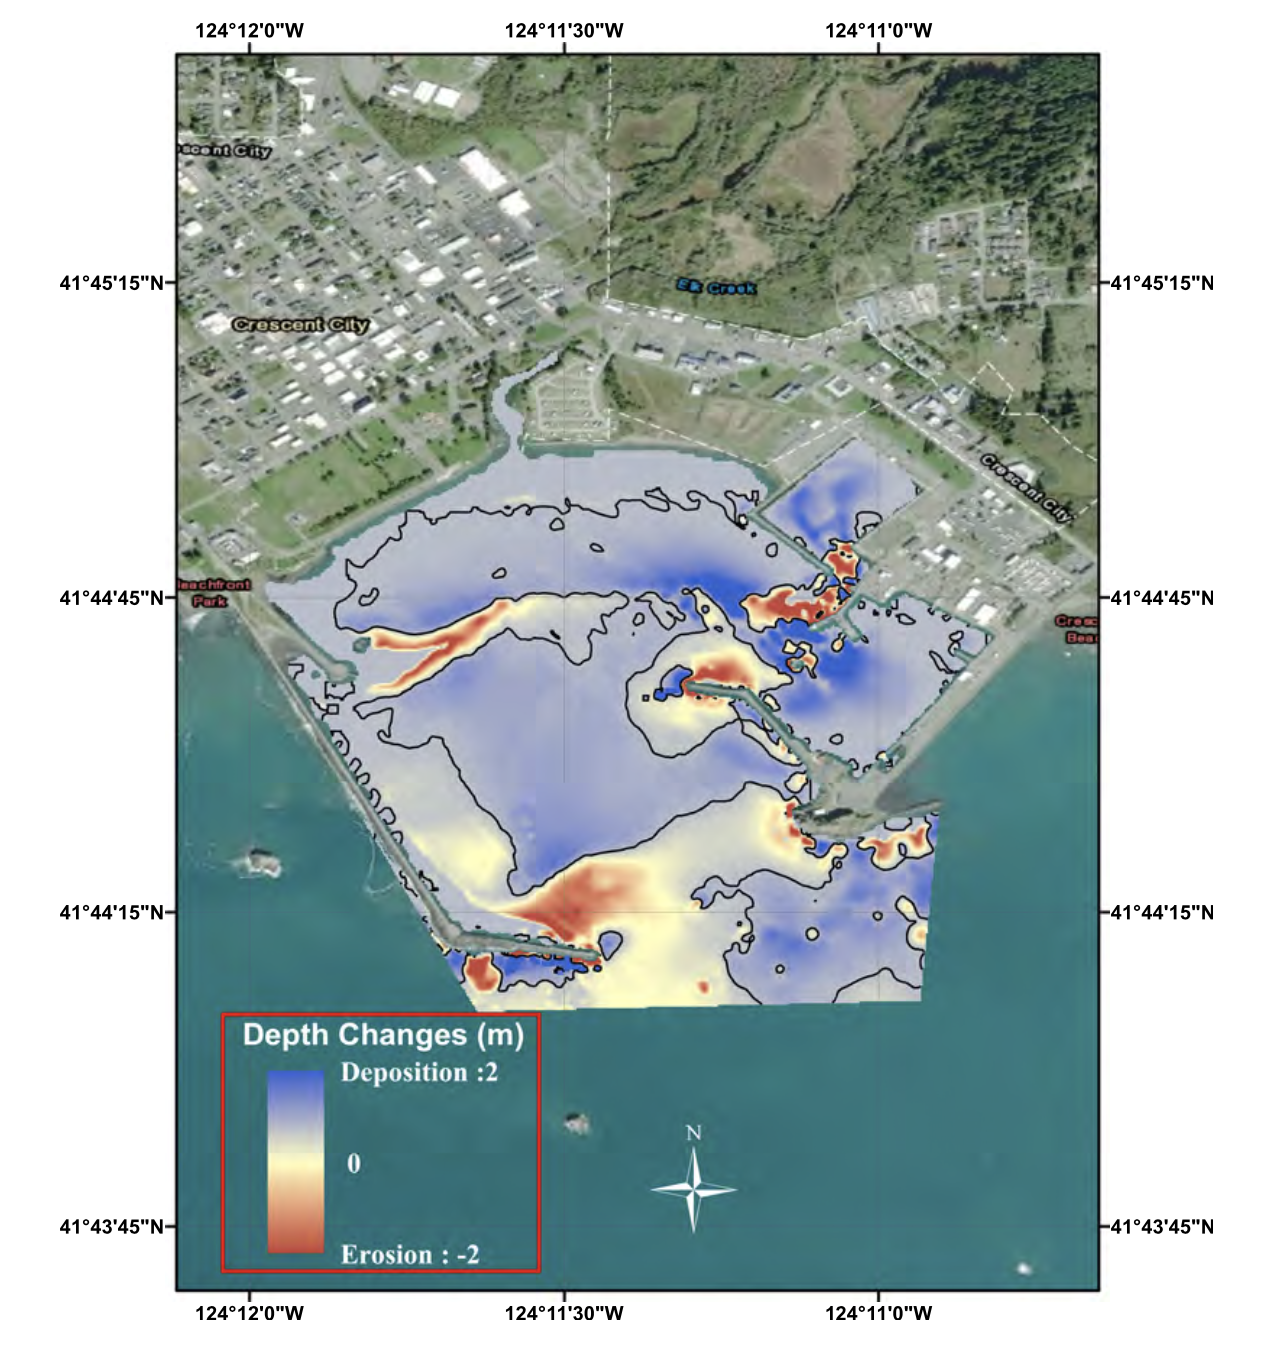
- Benchmark 1: Crescent City, CA: Impact of Tohoku 2011 tsunami event (Wilson et al, 2012)
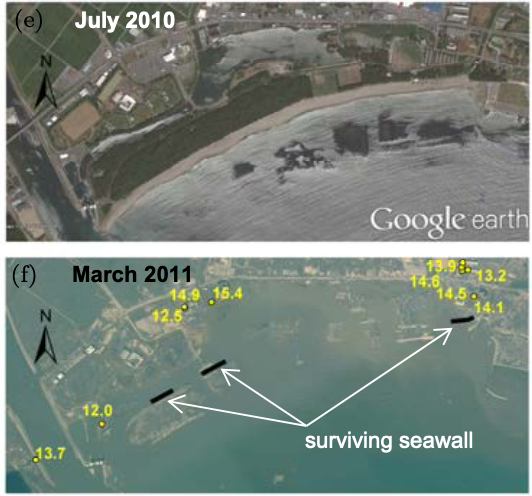
- Benchmark 2: Rikuzentakata City, Hirota Bay, Japan: Impact of 2011 Tohoku tsunami event
Benchmark 1's data set includes a pre-event DEM based on surveys described in Wilson et al (2012), and a post-event survey presented as a second DEM covering the same area. The provided data is described in the Benchmark link to the left. The problem here is entirely based on processes occurring below mean water level. There are no subaereal components in the test.Benchmark 2 includes both a dramatic example of destruction of a coastal bar system and extensive overland flooding, erosion and deposition. A description of the problem is contained in the link to the left.
Both Benchmarks 1 and 2 depend on simulations of the 2011 Tohoku event, for use as input to the local sediment transport modeling. We are presently providing nesting data for grids that represent the final level of nesting in the simulations of Yamashita et al. (2022), with the computations up to the final nesting level carried out using the model described in Tehranirad et al. (2021). Details on obtaining the nesting data are included in each problem description to the left. preparing input data for use as hydrodynamic boundary conditions for the final nested grid level described for each benchmark.
A laboratory benchmark is provided based on wave flume data collected by Yoshii et al (2017, 2018).
- Benchmark 3: Laboratory flume studies (Yoshii et al., 2017) (Yoshii et al., 2018)
Information about the individual benchmark problems can be found by using the links to the left. The data for each test will be made available either in its original format, or as .mat files.