DEPARTMENT OF POLITICAL SCIENCE
AND
INTERNATIONAL RELATIONS
Posc/Uapp 815
Descriptive Statistics and Numerical Summaries

- CLASS 8 AGENDA:
- Variance and standard deviation
- Box-and-whiskers plot.
- Measuring change
- Populations and samples
- Reading:
- Agresti and Finlay, Statistical Methods, pages 45 to 67 as needed.
- Note the box plot discussed in Agresti and Finlay is not constructed
exactly the same way as the one described below.
- Lewis-Beck, Data Analysis, pages 11 to 18.
- Try some of the early tutorials in the Student Edition of MINITAB for
Windows, such as the material starting on T-35.
- MEASURES OF DISPERSION:
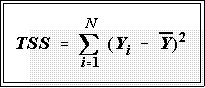
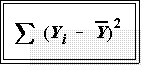
- Total variation: the total variation in a batch of numbers equals the sum of the
squared deviations about the mean.
- Recall form the last class that the total variation, also called the total sum
of squares, is defined by:
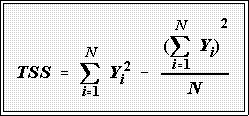
- Computing formula:
- When you have lots of data, the total sum of squares can be calculated
easily with a good calculator by finding the sum of the Ys' and the sum of
the Y's squared; that is:
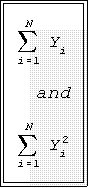
- Then put these quantities in this formula, called a computing formula:
- Example: Recall the Perot voting data
Table 1
Percent for Perot, 1992
New Jersey, by County
No |
Percent for
Perot |
No |
Percent
for
Perot |
| 1 |
17.6 |
12 |
15.8 |
| 2 |
12.9 |
13 |
17.1 |
| 3 |
20.4 |
14 |
15.5 |
| 4 |
17.6 |
15 |
19.3 |
| 5 |
20.1 |
16 |
13.0 |
| 6 |
19.0 |
17 |
26.0 |
| 7 |
9.7 |
18 |
17.4 |
| 8 |
23.1 |
19 |
22.0 |
| 9 |
7.9 |
20 |
11.4 |
| 10 |
23.6 |
21 |
23.8 |
| 11 |
15.5 |
|
|
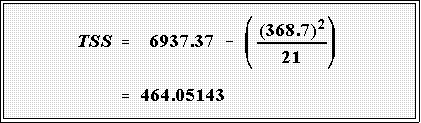
- For these data we obtain
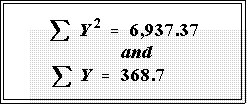
- Putting these quantities in the computing formula gives:
- Software and calculators.
- Nearly every calculator above those handed out by banks for opening an
account have an "accumulate" key, usually marked
 Key in a
number such as 17.6, then press the accumulation key; enter the next
number (e.g., 12.9) and press the accumulate key again. You should see
"2" in the display, which indicates that two numbers have been entered.
The sum of these two numbers and the sum of their squares has been
automatically calculated. Proceed in this manner for all N numbers. Then
press the "statistics" or "sum" keys (or whatever the instruction manual
says.) You should be able to read the totals and then perform simple
subtraction and division to get the total sum of squares.
Key in a
number such as 17.6, then press the accumulation key; enter the next
number (e.g., 12.9) and press the accumulate key again. You should see
"2" in the display, which indicates that two numbers have been entered.
The sum of these two numbers and the sum of their squares has been
automatically calculated. Proceed in this manner for all N numbers. Then
press the "statistics" or "sum" keys (or whatever the instruction manual
says.) You should be able to read the totals and then perform simple
subtraction and division to get the total sum of squares.
- You can, of course, just key the raw data into MINITAB or SPSS and
request various summations.
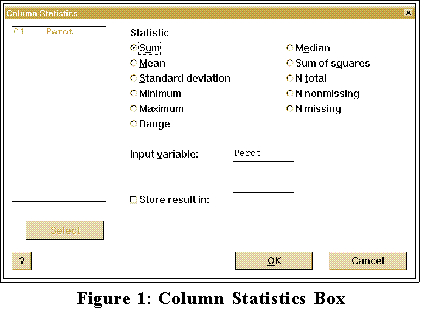
- In the Student Version of MINITAB for windows, open the calc
menus and select column statistics. In the dialog box just check or
click the totals and variables you want.
- The full version of MINITAB works essentially the same way.
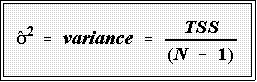
- Variance:
- The variance of a batch of
numbers or sample is denoted
 , for a batch
of numbers and represents the total variation divided by N minus 1:
, for a batch
of numbers and represents the total variation divided by N minus 1:
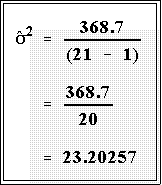
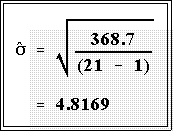
- Example: consider once again the Perot data.
- As seen above the TSS is 368.7. Therefore the variance of this
batch of numbers is:
- The larger the variance, the more variation or dispersion in the data. But at
this point it is difficult to give an intuitive interpretation to any particular
value such as 368.
- We'll get an intuitive feel for the dispersion or variation in a
moment and soon provide a more formal treatment.
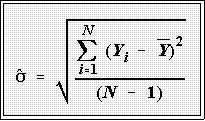
- The Standard deviation:
- The standard deviation of a batch of numbers or sample,
denoted
 is
(loosely speaking) the average of the squared deviations from the mean.
Since deviations indicate how much variation exists in the data, having an
average of these differences tells one about overall variation.
is
(loosely speaking) the average of the squared deviations from the mean.
Since deviations indicate how much variation exists in the data, having an
average of these differences tells one about overall variation.
- It is also the square root of the variance.
- To calculate the standard deviation, therefore, first obtain the total
sum of squares by summing the squared deviations from the mean
as before:
- Then divided this total by N - 1, where N is the number of cases in
the batch.
- Finally, take the square root:
- Example: for the Perot data we have simply
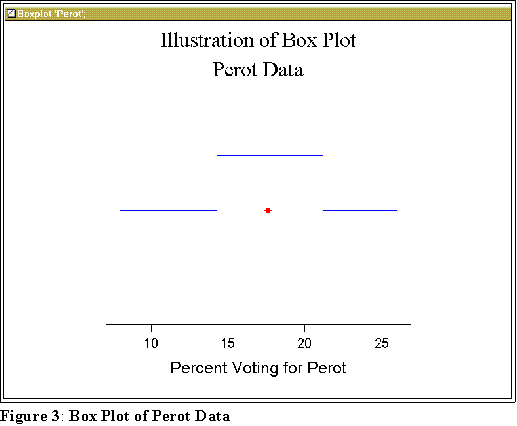
- A SIMPLE GRAPH TO SHOW VARIATION:
- For the moment put aside the standard deviation and variance and return to our
stem-and-leaf displays and order statistics: the median, the hinges, and the
maximum and minimum.
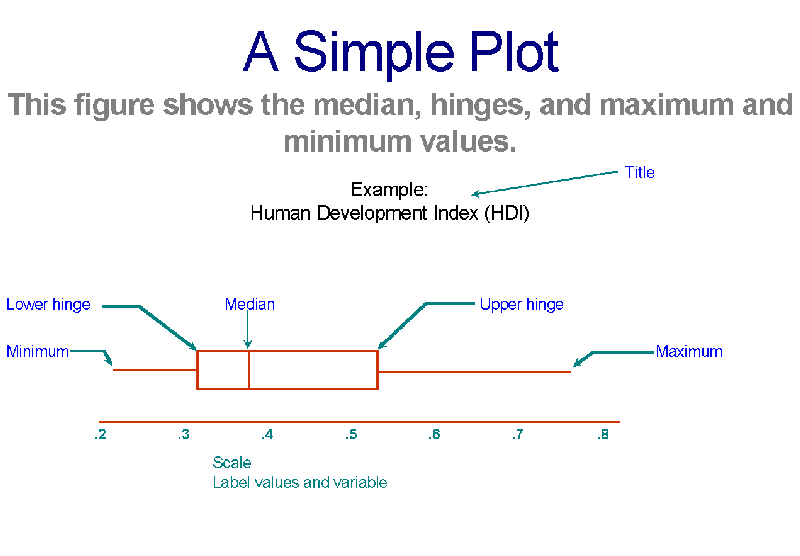
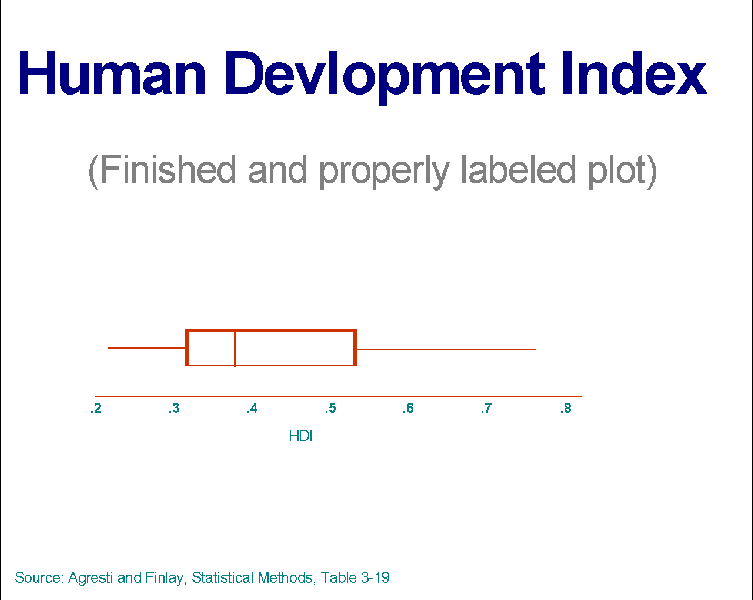
- We can combine these summaries in a graph called a box-and-whiskers plot
or more simply a box plot.
- Drawing the box plot.
- See Figure.
- First, draw a horizontal line to indicate the scale of the variable.
- Above the line, say about half an inch, draw a small vertical line to indicate
the median.
- It should correspond to the value on the scale. See the figure.
- Next draw short vertical lines above the scale to indicate the hinges.
- Make a rectangle with the hinges at the ends. The median will be in the box
somewhere.
- Next, place points or marks of some kind to represent the maximum and
minimum values.
- Connect these points to the hinges with horizontal lines.
- Figure 2 shows an example.
-
Here's a more detailed view.
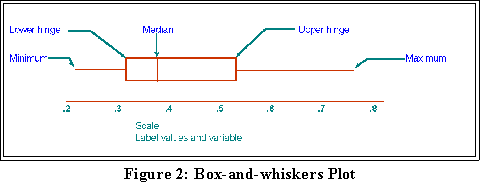
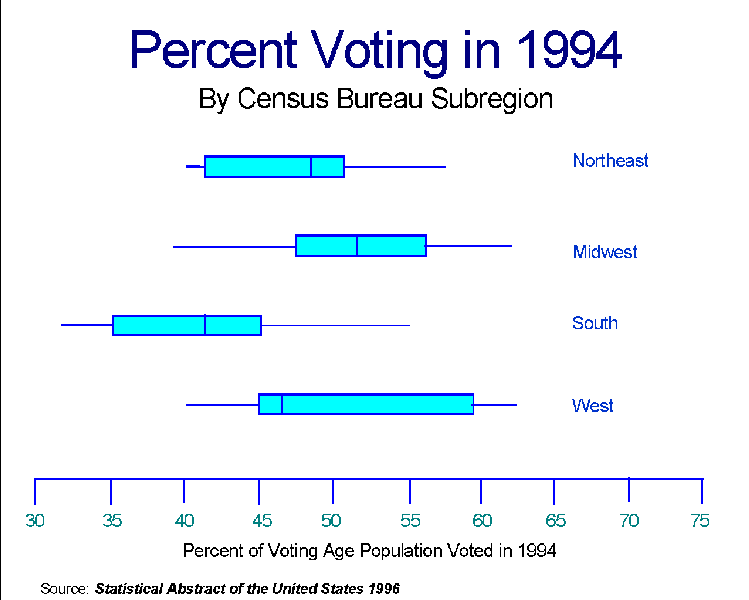
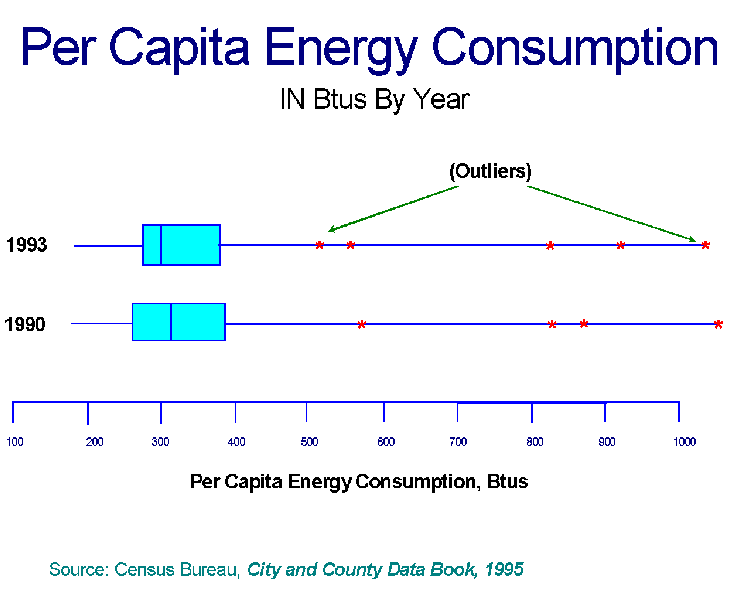
- We can use the plot to visual the variation in a batch of numbers. It is
especially helpful for comparing the shape, central tendency, and variation
in several groups of data sets.
- We'll see some examples in class.
-
Percent Voting Example
-
Energy Consumption Example
- These two examples show how box plots can be used
to compare distributions.
- For now here's the Student Version of MINITAB's box plot of the Perot data.
- MEASURING RELATIVE CHANGE OR DIFFERENCES:
- Here are some data:
- Here is another comparison:
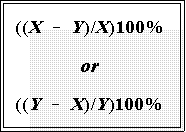
- Question: how should relative change or difference be measured? The standard
approach is to calculate the percent difference. Most calculators do it this way:
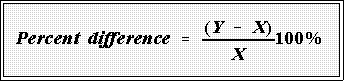
- This usual measure of relative change or difference has at least two problems.
- First, it lacks "symmetry" in that the numerical value depends on which
number is taken as the base. Thus, we have
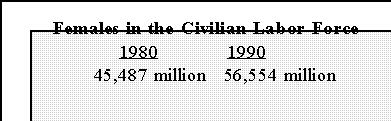
- In the case of female employment, we can say that it is 24.3 percent
higher in 1990 than in 1980 or that it increased 19.6 percent from
1980 to 1990. Put the data in the formulas to see this for yourself.
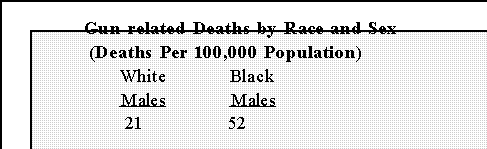
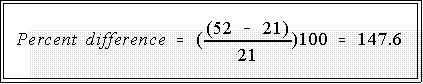
The point is better illustrated with the homicide rate. We can say
either that the rate is 147.6 percent higher for blacks than whites or
it is 59 percent less for whites. Again, do the calculations. Example:
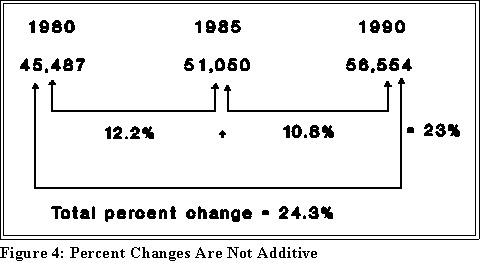
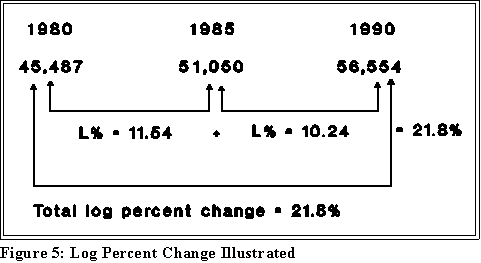
- Second, the usual indicator of relative change is not additive over
successive time periods. Notice that in Figure 4 the percent increase
in the women in the labor force in the 1980 to 1985 period is 12.2%
and the increase in the period from 1985 to 1990 is 10.8%. These
add to 23 percent. But, as we saw before, the overall increase from
1980 to 1990 is 24.3 percent.
- For these reasons, some statisticians have proposed alternative measures of relative
change or difference. One such proposal has been presented by Leo Tornqvist and
his colleagues. They call it the "log percentages."
- The formula is
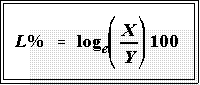
- We use the natural logarithm for this calculation. Most good calculators
have it as one of their functions. It is usually denoted "ln" in contrast to
"log," which means log to the base 10. Needless to say, MINITAB has
natural logs (the function is loge).
- This statistic, denoted L%, avoids the problems mentioned above, even though it is
not at first as intuitively obvious as the standard measure. For example, the relative
difference between black and white homicide rate is
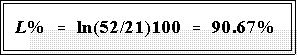
- That is, the rate for blacks is log 90.67 percent higher for blacks than whites. If we
wanted to find out how much lower the white rate is, we would simply calculate;
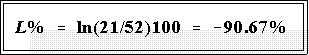
- Hence, the rate for whites is log 90.67 percent less than for blacks. Note that
the two log percentages are symmetrical; they differ only in sign.
- The log percentage increase in women in the labor force from 1980 to
1990 is 21.8%. This is the sum of the log percentage increases over the
time periods 1980 to 1985 and 1985 to 1990 (log 11.54% plus log
10.24%). This is illustrated in the following figure.
- POPULATIONS AND SAMPLES:
- Population: a well-defined collection of units of analysis such as the American
states, the people living in Delaware, the countries in Asia, the students taking this
course.
- Sample: a subset of the population drawn in some fashion. We can have, for
example, a sample of the states, a sample of Delawareans, or a sample of students
taking this class.
- Simple Random Sample (SRS): a sample drawn from the population in such a
way that each member has an equal chance of being included.
- Sample sizes, N.
- We have briefly discussed samples sizes and will do so in more detail when
covering statistical inference.
- For now note that large samples are not necessarily essential for producing
"valid" results. In fact, N probably has more to do with "reliability."
- Parameter: a statistical characteristic (e.g., mean, standard deviation) of a
population. Two major goals of statistics are to estimate population parameters
and to test hypotheses about them.
- Parameters are usually denoted with Greek letters.
- Example: the mean, usually denoted by , is a parameter.
- Sample statistic: a characteristic of a sample or batch of values that is generally
used to make inferences about the corresponding population parameter. (Often
called an estimator.)
- Sample statistics are frequently denoted by a Greek letter with a hat over it
(e.g.,
 ) but not always
as in the case of the sample mean,
) but not always
as in the case of the sample mean,
 .
.
- NEXT TIME:
- Distributions
- Shapes and properties
- Operations and rules of the summation sign.
 Go to Statistics main page
Go
to H. T. Reynolds page.
Copyright © 1997 H. T. Reynolds