DEPARTMENT OF POLITICAL SCIENCE
AND
INTERNATIONAL AFFAIRS
POSC/URAF 815
CORRELATION AND REGRESSION

- AGENDA:
- The linear regression model.
- Properties of the regression parameters
- Parameter estimators
- Calculating estimates
- Examples of the
interpretation regression and correlation coefficients.
- Reading:
- Agresti and Finlay,
Statistical Methods Chapter 9,
pages 307 to 318, 325
to 326.
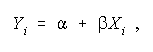
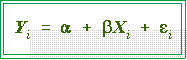
- THE TWO VARIABLE LINEAR REGRESSION MODEL:
- A simple equation specifies the
two variable linear regression model

- As noted last time
this model consists of two components a systematic part and a
random error term.
- Systematic (or deterministic) component (see Agresti and Finlay, page 314):
- The systematic component,
 shows how changes in the
independent variable, X, are related to changes in the dependent variable Y.
shows how changes in the
independent variable, X, are related to changes in the dependent variable Y.
- The nature and magnitude of the connection is given by the
regression parameter, b:
it indicates how much Y changes for a one
unit change in X.
- The regression constant, a,
is interpreted as the value of Y when X equals
0.
- Random error term:
- The presence of an error term, ei,
suggests that Y is not a perfect or exact
function of X. If it were, then there would be no errors and the error term
would be unnecessary.
- One interpretation of error is that variation in Y is not fully understood;
one can attribute a portion, whether large or small, to the "effects" of X,
but a portion remains unexplained even after X has been introduced into
the analysis.
- Another way is to think of each observation's score as
consisting of a
systematic part that is a function of X and an error. Thus, two units might
have the same X scores, say the same incomes, but differ with respect to Y
purely by chance.
- Of course their different Y scores might be (partly) explainable by
another variable, Z, that could possibly be measured and included in
the equation. (See multiple regression.)
- When applying regression analysis one makes important assumptions about
this error component:
- The errors are random:
- Think of the errors this way: for each value of X, there are
many observations, say Ni. Each of these observation's Y
score consists, as we have seen above, of a systematic part
and an error. Thus, for each value of X there is an error
term, ei.
- And since there are many Xs there are distributions of errors
around the X values, as this figure suggests.
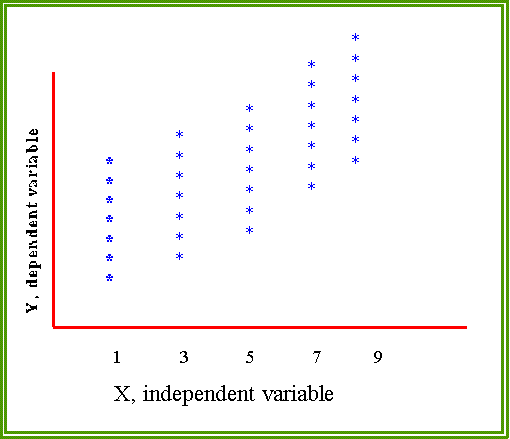
- The points represents observations or cases. For each value
of X there are several Y scores. Although the cases may
have the same Xs, their Y scores vary among themselves.
What is the source or "cause" of this variation? It is
assumed to be due to random error.
- The expected value of
the ei
is 0.
That is, the errors "cancel
out."
- More formally, for each X there is a distribution of errors,
ei. Each error
plus the X constitutes a Y score.
- The expected value or mean of the these errors is assumed to be 0
and E(ei) = 0
- The variance of the errors at one level of X is assumed to be the
same as the variance of the errors at another level for all pairs of
levels:

- This means the variation of the errors at level k equals the variation
at level j which in turn equals a constant.
- This is the (in)famous assumption of homoscedasticity.
- The errors are assumed to be independent of X. That is,

- Assumptions about errors are important for making inferences and estimating
parameters.
- PROPERTIES OF THE REGRESSION COEFFICIENT:
- As noted last time, the regression coefficient is measured in units of the dependent
variable.
- Its numerical magnitude thus depends on the measurement scale used in the
analysis.
- If, for instance, one regressed income measured in dollars on education
measured in years, b will probably have a large value.
- b = 3,500.45 means that as education goes up by one year income
will increase $3,500.45.
- On the other hand if income is measured in thousands of dollars, the
corresponding regression coefficient would be about 3.545,
meaning that as education moves up by one year income moves up
by 3.50045 units or 3.50045 thousands of dollars or $3,500.45 (=
3.50045 X 1,000).
- For this reason the regression coefficient is called unstandardized. Think of its
value as being affected by the measurement scales. Even innocuous changes will
alter the numerical value.
- Consequently, a b of 10 may or may not be comparable to a value of 100.
The validity of the comparison depends several factors, especially the
scales.
- Suppose b1
equals 10 and b2 equals 100.
One is not justified in saying on
the basis of this evidence alone that the second variable is 10 times as
important or even 10 times as large as the first.
- The regression coefficient is asymmetric:
its numerical value depends on which
variable is considered independent.
- When someone says "Y is regressed on X," it means Y is considered the
dependent variable.
- With two variables two equations are possible.
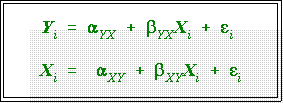
- As we'll see shortly
the a's
and b's
in these equations are usually not the
equal.
- Thus it is important to specify or indicate or know which variable is
independent and which is dependent.
- Sometimes the choice is arbitrary in the sense that the investigator
may not have reason to think one is dependent on another. Still, to
use regression programs and interpret their results it is necessary to
choose one variable as independent, the other as dependent.
- The sign of the regression
coefficient indicates the direction or form (positive or
negative) of the linear relationship.
- Hence if b = -2.5,
then a one unit increase in X is associated with a 2.5
decrease in Y, which is just a
case of negative correlation.
- The regression coefficient differs from the
correlation coefficient in these ways:
- r is unstandardized:
its value always lies between -1.0 an +1.0, no matter
what the measurement scales.
- Thus, some feel that the way to compare two independent
variables' effects on or correlation with a dependent variable is to
compare r's, not b's.
- This practice can be very misleading, however.
- r is symmetric: its value does not depend on which variable is treated as
independent.
- The r between Y and X is the same as the r between X and Y.
- Here's an example. (We'll see others). Suppose we want to know if
SAT tests are a valid indicator of college performance. We collect a
random sample of 200 transcripts form the registration office and
perform a some regression and correlation analyses.
- We would expect college grade point average (GPA) to
depend on or be a function of apptitude as measured by the
SAT verbal score. So we regress GPA on verbal scores.
- Note: this example is based on the file "grades," which is
part of the Student Version of MINITAB for windows. It's
also available in the example files of the full version.
- Here are the results
| Dependent
variable is... |
Regression
Constant |
Regression
coefficient |
Correlation
coefficent |
| GPA |
1.1075 |
.0025560 |
.322 |
| Verbal |
488.67 |
8.486 |
.322 |
- When GPA (the dependent variable is regressed on verbal
scores the estimated regression parameter is .002556 or
about .003. This means that a one point increase in the
verbal aptitude is associated with a .003 point increase in
grade point average.
- As an aside, an SAT verbal score of 0 would be associated
with a GPA of 1.1, not bad for someone with no aptitude at
all.
- If we mistakenly treated verbal scores as the independent
variable and tried to interpret it as before, we would
erroneously conclude that a one unit increase in X would
lead to 8.486 increase in grade point average, an obviously
nonsensical result.
- Note, finally, that the correlation between scores and GPA
is .322 no matter which variable is considered dependent.
- ESTIMATING REGRESSION PARAMETERS:
- Let's look at a plot with a regression line drawn through the points.
- This example comes from the Data and Story Library. Here's the
background:
- "Government statisticians in England conducted a study of the
relationship between smoking and lung cancer. The data concern
25 occupational groups and are condensed from data on thousands
of individual men. The explanatory variable is the number of
cigarettes smoked per day by men in each occupation relative to the
number smoked by all men of the same age. This smoking ratio is
100 if men in an occupation are exactly average in their smoking, it
is below 100 if they smoke less than average, and above 100 if they
smoke more than average. The response variable is the standardized
mortality ratio for deaths from lung cancer. It is also measured
relative to the entire population of men of the same ages as those
studied, and is greater or less than 100 when there are more or
fewer deaths from lung cancer than would be expected based on
the experience of all English men."
- We first plot the variables as in the next figure, which also shows
the regression line passing through the points.
- First note that the "units" are occupations such clerical,
professional, service.
- Second, and more important, note that the line passes through the
"center" of the points.
- So obviously some observations lie above, some below the
line.
- Now ask: where did this line come from? Why is this the regression
line? Why not some other line?
- Well, to answer that question consider the figure on the next page.
- It shows the same plot with a different "regression" line. This one,
however, seems to fit the data less well in that most of the points
are farther away from the line than in the first graph.
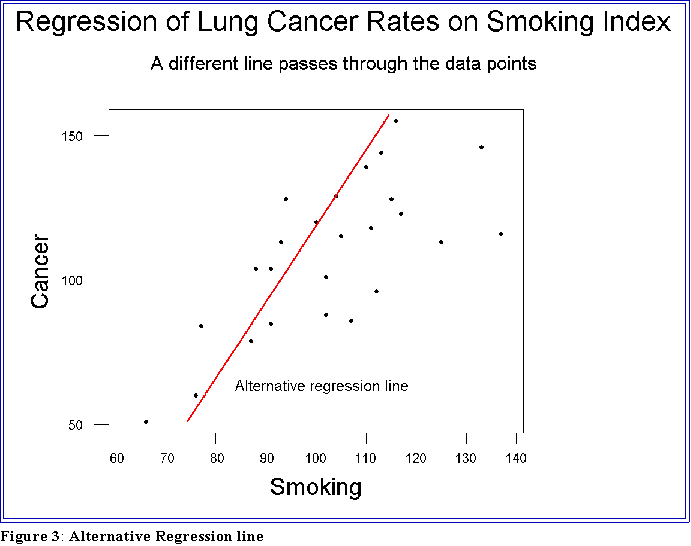
- We can be a bit more precise when saying that one line fits the data
better than another.
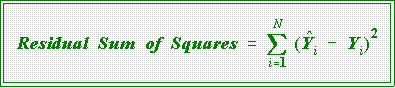
- Least Squares:
- An observed data point
can be thought of as a Y score produced by a
linear regression function plus an error. In symbols:
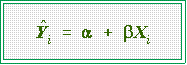
- If we ignore the error we obtain an equation
for a predicted or estimated
value of Y
- Normally, the predicted value will not equal the observed score. There will
be an error or residual left over, namely
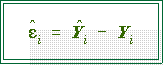
- The hat over the Y indicates that the systematic part of the model
gives a predicted value of Y
- The residual is just the observed value of Y minus the predicted
value, the prediction being based on a linear equation. That is,
- There will an error, ei for each observation.
These errors are called residuals.
- The method of least squares.
- The linear regression equation is constructed or computed in such a way as
to minimize the sum of the squared errors.
- The diagram below shows the regression line, the predicted Y, which lies
on the regression line, and the observed Y. The gap between the two points
(predicted and observed) is the residual,
ei.
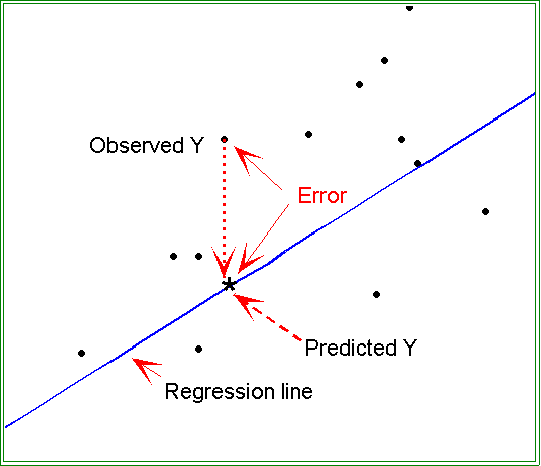
- The regression parameters are estimated in such a way the sum of all of
these residuals or errors squared is a minimum.
- For this reason the algorithm for calculating the regression
parameters is called least squares and the technique is often called
ordinary least squares (OLS).
- Stated slightly differently the calculation procedure selects the
regression parameters, a and b, so that the predicted Y's lead to
the smallest sum of squares possible.
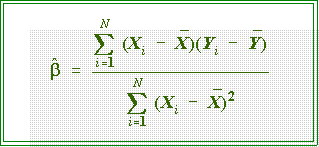
- Computing formulas:
- We can't go into the derivation of the computing formulas used the least
squares principle. Instead we will simply state that they are calculated from
raw data as follows:

- The formula for the correlation coefficient is
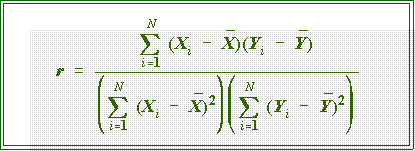
- To find R2, sometimes
called the coefficient of determination, just square
r.
- Note: MINITAB
presents R2 as a percent. But you should report it
as a decimal. After all, its range is from 0 to 1.0. Why?
- Regression analysis with MINITAB and SPSS.
- In MINITAB go to the Statistics menu, then pick Regression. In the
dialogue box just select the dependent (response) and independent
(predictor) variables. You won't need any of the options for now.
- Do the same in SPSS: go to Stat, then select Regression and Linear.
- INTERPRETING COMPUTER OUTPUT:
- Although most regression programs display lots of statistics, we are for now
interested mainly in the coefficient estimates and R2. Later we will use more of the
information.
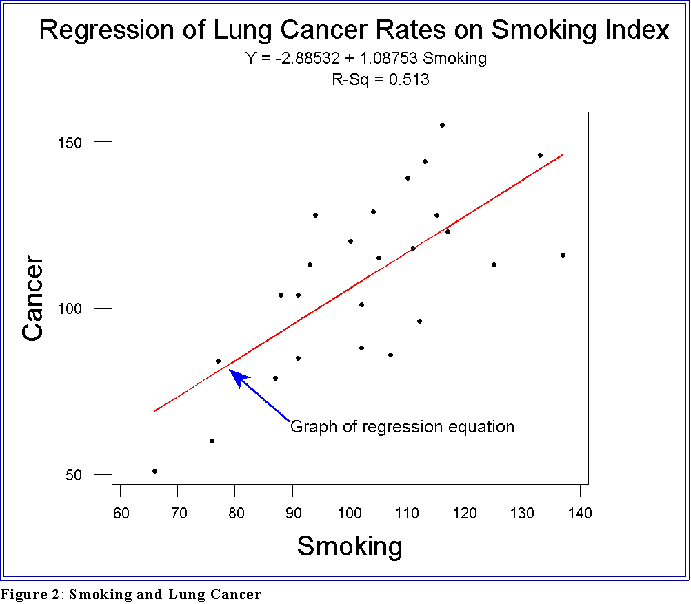
- MINITAB regression results for the smoking and cancer example.
- The most important display is the first, namely the estimated or calculated
least squares equation:

- This simply shows the estimates of a and b. In this example, a equals -2.9
and b is 1.09.
- You know how to interpret them. For each 1 unit increase in the
smoking index, cancer increases by 1.09 units. If no one smoked (X
= 0), then the predicted cancer rate would be -2.9, not a very
sensible result.
- The remainder of the printout shows additional information that will be
useful later:
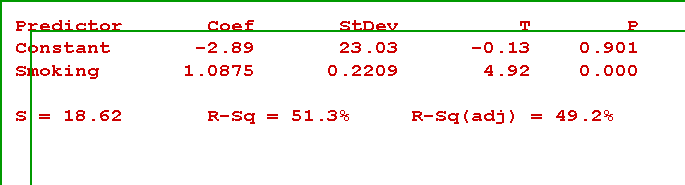
- The coefficient estimates are shown along with statistics used in
determining their "statistical significance."
- Next, find R2
and an adjusted R2. Both are interpreted as we have been.
One might say, as an example, that smoking accounts for or explains about
50 of the variation in lung cancer rates.
- Although it is very important, ignore the S statistic for now.
- After this information appears MINITAB produces an analysis of variance
box:
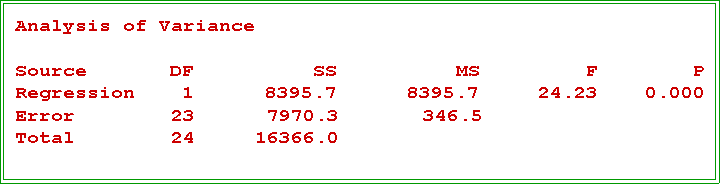
- The total sum of squares are displayed on the bottom. (Here the sum is
16,366.)
- That portion due to regression (that is, to X or the explanatory
variable) is 8,395.7. Note that is 51.3 percent of the total.
- The unexplained or error sum of squares is 7,970.3
- Please keep in mind the remarks I made in reference to the meaning
of explanation.
- SPSS output looks pretty much the same.
- Make sure that the dependent and independent (predictor) variables are
properly selected. Otherwise, as noted before, you results will incorrect or
misleading.
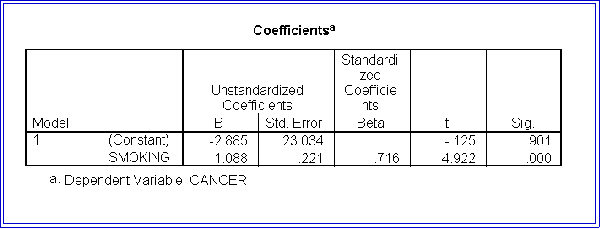
- Here is the parameter section of the output for the smoking example:
- Like MINITAB, SPSS provides an analysis of variance table:
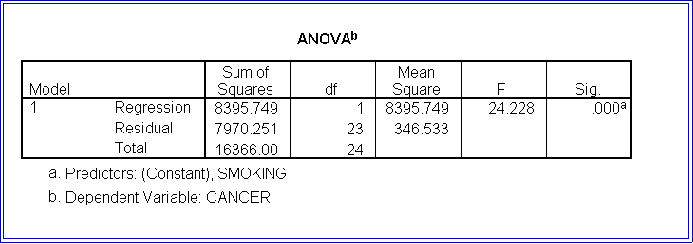
- It also supplies much additional information, some of which we cover later.
- Note that the two programs report slightly different values for b. We will not be
bothered by these discrepancies, but if you use SPSS on your assignments be sure
to tell me. Nevertheless, statisticians spend a lot of time trying to decide which
program produces the most accurate results. (I have no idea in this example which
is best.)
- EXAMPLE -SURGICAL PROCEDURES:
- Now for another and perhaps more realistic example. This data set pertains to the
general problem we considered previously, namely what explains the soaring cost
of health care.
- We investigated one
hypothesis that states that contrary to expectations,
the wide availability of health care services does not reduce the cost of
providing them. One explanation is
that availability health resources is
positively correlated to their use.
So the more facilities, the more doctors
and patients take advantage of them.
But this availability does not reduce
costs.
- Now, we can't
completely "test" this proposition, but we can throw some
light on it.
- The variable definitions
for the data set, which is called
Surgical Procedures
are:
- c1 Number of surgical procedures
- c2 Number of surgical specialists/100,000
- c3 number of general surgeons/100,000
- c4 Population in 1990
- It is important to obtain a per capita or indexed measures of surgical procedures
by dividing the number of procedures, c1, by the population, c4.
- So put the result somewhere (e.g., let c5 = c1/c4.)
- First let's plot the dependent versus the independent variable in order to take a first
look at
- the variation in X and Y
- the pattern (if any) of the relationship between them.
- We can then find the correlation between per capita procedures and surgical
specialists and between per capita procedures and the number of general surgeons.
- In MINITAB go to Descriptive and then Correlation. Enter the list of
variables.
- We are interested in the correlation of the dependent variable, log
surgical procedures per capita (c5) with the two independent
variables, number of surgical specialists (c2) and the number of
general surgeons (c3).
- Below is a correlation matrix: it displays the correlation
coefficients among all pairs of variables.
| Variables |
c5 |
c2 |
c3 |
| c5 |
- |
|
|
| c2 |
.637 |
- |
|
| c3 |
.737 |
.968 |
- |
- As discussed above, the correlation coefficient, r, is symmetric: its
value is the same no matter whether X or Y is considered
dependent. So rYX = rXY. Since the entries above the main diagonal
of the matrix simply mirror the ones below, they can be and usually
are omitted.
- We see that surgical procedures and availability of surgeons are
highly, positively correlated.
- The greater the number of surgeons (per 100,000
population), the greater the number of surgical procedures
per capita.
- The estimated regression equations are Estimated per
capita procedures = 0.0527 + 0.00301 (number of
surgeons) and Estimated per capita procedures =
0.0519 +0.000873 (number of specialists)
- The data "fit" a linear model reasonably well:
- r2 # procedures X surgical specialists = .4058.
If we are careful and
mindful of the limitations of the statement, we could
assert that number of surgical specialists explains
about 40 percent of the variance in the number of
surgical procedures.
- Similarly, number of general surgeons "explains"
about 50 percent of the variance in Y; that is, the
correlation is r2 # procedures X general surgeons = .5432.
- Note that these latter statements apply only to statistical variation.
We may or may not have improved our understanding of health
care. In particular, it seems likely that we need to examine another
variable, Z = per capita income, because it may be the case that
wealthier states have more surgeons and also better or more
complete insurance, thus providing more opportunities to take
advantage of these specialists.
- NEXT TIME:
- More regression examples
- Time series and intervention analysis
 Go to Statistics main page
Go
to H. T. Reynolds page.
Copyright © 1997 H. T. Reynolds