DEPARTMENT OF POLITICAL SCIENCE
AND
INTERNATIONAL RELATIONS
Posc 150
WHY DON'T PEOPLE VOTE?
REQUEST FOR PROPOSAL
SPONSORED BY
THE NATIONAL CIVICS ASSOCIATION
(SOME MORE EXTRA CREDIT)
Worth Up to 10 Points
Note: you should
see the version of this document
on the class web page for examples.
The National Civics Association (a hypothetical group
patterned after the League of
Women Voters) is disturbed by the downward spiral in voting turnout.
Since 1960 fewer and
fewer eligible voters participate in presidential and congressional elections. The Association plans
to sponsor "get-out-the-vote" drives in 2000 but doesn't have the
money to mount a national
campaign. Hence it wants to target groups of citizens who vote
less than average. It's willing to
spend $100,00 to $200,000 on consultants who can identify the
kinds of people most likely to
respond to such a effort. Hence it's distributing this request for proposal
(RFP). You can, if you
wish, apply.
In order to win this contract you need to convince the Association
that you and your
associates have the skills to collect, present, and interpret
survey data. Naturally it also has to
have confidence that you can produce an intelligible report in a
short span of time.
This proposal should demonstrate that you can find the
"correlates" of voting participation; that
is, you can identify traits that are connected to low and
high rates of turnout. You might find, for
example, that unmarried people vote less regularly than
married couples. If so, the Association
would have to modify (perhaps) its information and
persuasion campaigns.
To prepare your proposal you need to rely on data
from a reliable source. Undoubtedly
the best survey data pertaining to voting data
come from the Center for Political Studies and are
presented in biannual "national election studies."
Although the data are of the highest quality, they
do require care in handling and interpreting. It's
no small task. On the other hand, the rewards can
be substantial for not only can you compete for this
"award" but you will gain invaluable
experience.
The Association (and it alone) makes the
final decision whether to award you the contract.
Moreover, it relies solely on its judgment.
Simply submitting a proposal does not guarantee you anything.
The Association needs your presentation by
Novermber 15, 2000 at the latest.
Here are guidelines, directions, and tips.
Read them carefully because the analysis system
you will use requires exact spelling and punctuation.
You can earn up to 8 points of extra credit.
But as always nothing is guaranteed, no matter how
hard you work or how much time you spend.
- OVERVIEW:
- You are going to compare people with different social, economic, and political
characteristics to see if and to what extent they differ in their voting turnout rates.
- For instance, you can compare the turnout rate blacks and whites or
married and unmarried people.
- First, you need data.
- Use the "1996 National Election Study (NES).
- Lucky for you it happens to be available from the course web site.
(See below.)
- Find dependent and independent variables.
- The only dependent variable you need is "voting": respondents are
asked whether or not they voted in 1996 presidential election.
- You'll compare people's responses to see if there are
patterns.
- You can choose from as many so-called independent or explanatory
variables such as race, education, income, martial status, party
identification, and so forth as you wish.
- Then, create cross-tabulation tables that show the relationships between each
independent variable and the dependent variable.
- Example: you might have a table that compares white and black
respondents and another table that compares married with single people.
- Percentages are used to make the comparisions.
- Finally, write a brief summary of the results that tells the Association which groups
it should be targeting for voting information and mobilization.
- The steps are explained in more detail below.
- WARNING: YOU HAVE TO PAY ATTENTION. CHECK
SPELLING AND PUNCTUATION.
- CODEBOOK:
- You are going to use what
survey researchers call a "codebook."
- A codebook lists question wordings and
possible responses plus other
information.
- Each possible responses is given a numeric code.
- For example, when the interviewer records a person's race, the
codes might be 1 for "white," 2 for " black," 9 for "not
ascertained."
- The codebook also indicates how many
people gave each response.
- It also records non-substantive
responses such as "don't know" or not
"appropriate."
- These codes are called missing data.
- DATA:
- Go to the SDA Survey Documentation and Analysis web page, which is at the
University of California.
- Some of you have been here before.
- Reach it from the class web page by clicking on "For Your
Information."
- Then go to "Useful Sources of Information."
- When you've reached that point click "Elections and Campaigns"
and find CSA.
- Or just use the internet site in the next step.
- Click on SDA Archive
- Click on " (Abst) | NES for 1996 (version with new weights) "
- Make sure "Browse codebook (in this window)" is checked and click Start
- Note: this codebook is huge; it contains several thousand questions.
- Click on "Headings for Groups of Variables"
- Find the following groups of variables:
- "INTERVIEWER OBSERVATIONS REGARDING R" and click on the
link.
- If you don't see the title scroll to the top and use the Find (Control-F key) in your Netscape browser to find the phrase "Interviewer
Observations."
- Internet Explorer has a similar feature.
- Find:
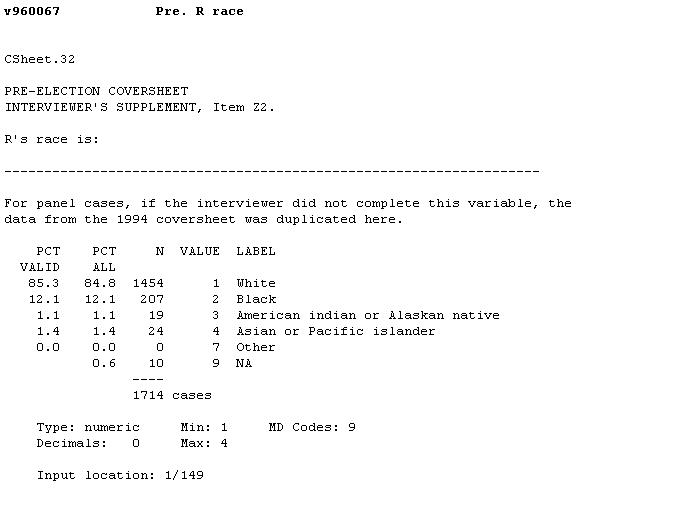
- "v960066 Pre. R's gender"
- "v960067 Pre. R race"
- Note: the highlighted variable code is an
identification number used to keep track of
information.
- The "v" stands for "variable"; the "96" for the 1996
election study; and the four-digit number for the
particular question.
- Pay attention to the number since you need it.
- Click on these variable numbers and read the text of the
questions.
- Carefully note the variable numbers.
- Return to the "Headings for Groups of Variables" page.
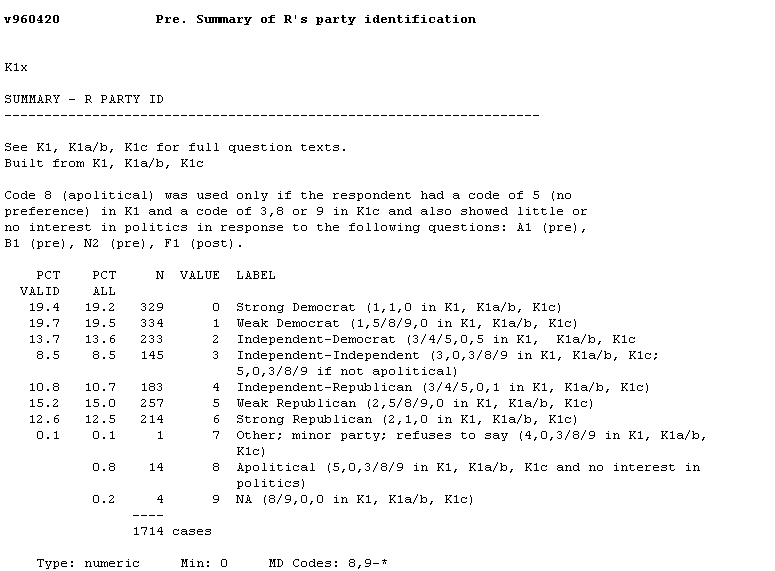
- "R's PARTY IDENTIFICATION"
- Find:
- "v960420 Pre. Summary of R's party identification"
- Make sure you have the "Summary"
- This question is self explanatory. It ask people
whether or not and to what degree they feel close to
or identify with a political party.
- Look at the responses; they say a great deal about
the current state of American politics.
- As before return to the "Headings for Groups of Variables" page.
- "PERSONAL DATA: DOB/AGE/MARITAL STATUS/EDUCATION"
- Find:
- "v960606 Pre. R's marital status"
- "v960610 Pre. Summary of R's education"
- "v960605 Pre. R's Age"
- These are some social and economic characteristic variables you
can use.
- Again, click on the numbers and read the questions, note the
responses, and the codes and missing data.
- As before return to the "Headings for Groups of Variables" page.
- "PERSONAL DATA: EMPLOYMENT HISTORY"
- Find:
- "v960676 Pre. Stacked -- R collapsed occupation code"
- Scroll down to find it.
- You can compare voting behavior of people in
different occupations.
- As before return to the "Headings for Groups of Variables" page.
- "FAMILY AND PERSONAL INCOME IN 1995"
- Find:
- "v960701 Pre. R's family income in 1995"
- This is family income, an indicator of social standing
or well being.
- You can use it to compare the participation rates of
upper, middle, and lower class individuals.
- As before return to the "Headings for Groups of Variables" page.
- "VOTE FOR PRESIDENT/HOUSE/SENATE CANDIDATE"
- Find:
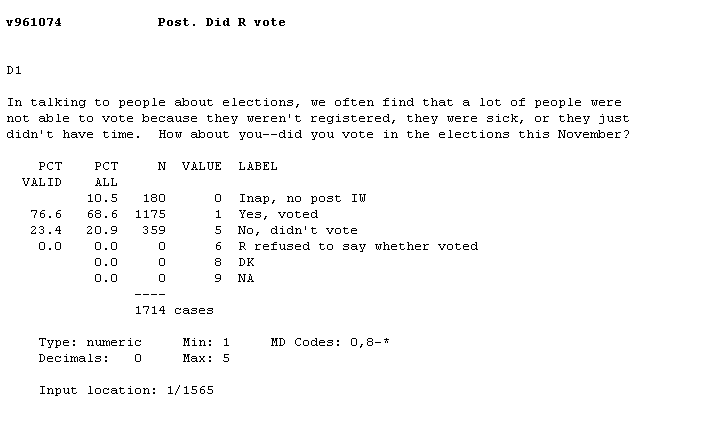
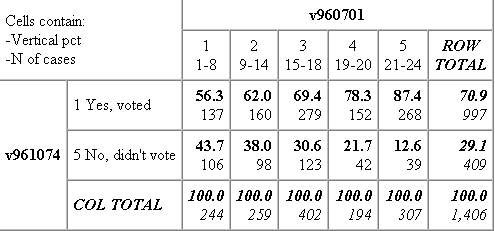
- "v961074 Post. Did R vote"
- This is the key dependent variable. Make sure you
note its identification number, since you'll be using it
so much.
- Example
- Note also that about 77 percent of the respondents
claimed they voted. We know this is wrong because
the actual percentage of votes cast is much lower.
- It suggests that the many voters lie to interviewers.
- Does this raise questions about polling? Ask
me for a rap.
- As before return to the "Headings for Groups of Variables" page.
- Look for other questions or "variables" that might be useful
- But be careful: many of the items pertain only to special research
interests and won't be helpful.
- Some variables have so many response categories that they
can't be conveniently summarized.
- ANALYSIS:
- I suggest that you start a separate copy of Netscape or Internet Explorer.
- In other words you can have two or more windows running at the same
time. That way, you can just highlight, copy, and paste into dialog boxes.
- Whatever your decision return to or go to the main
"SDA Demonstration Survey Data Archive" NES page.
- Click " Run crosstabulation" and press start
- You should now be at the "SDA Tables Program" page.
- Here you enter the information necessary to make
a cross-classification or
contingency table.
- The categories of the independent variable are the column labels, whereas
the categories of the dependent variable are the row labels.
- The entries in the body of the table indicate how many (or what percentage
of )people have particular combinations of responses.
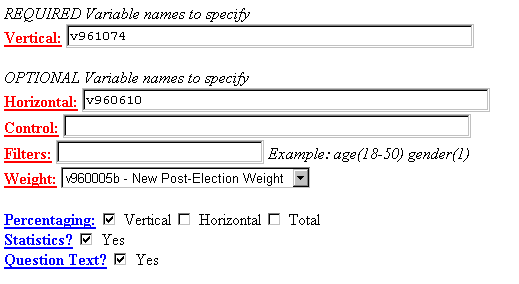
- In the box labeled "Vertical:" type in the
code number of the dependent variable,
which in this instance will be v961074.
- Don't type in anything else; just the code.
- Pay attention to the spelling.
- It's very helpful to highlight the code number in one window, copy it, and
paste it the box of the other window.
- In the box labeled "Horizontal:" type in the code number of the first explanatory or
independent variable.
- Example: v960066 if you want to compare men and women.
- Make sure "v960005b New Post Election Weight" is
highlighted in the "Weight"
box.
- Check "Percentaging: Vertical" and "Question Text?"
- Press "Run Table"
- READING THE DATA:
- You'll find it helpful to print or copy the
table(s) so you can interpret the
information at your leisure.
- "Read" or interpret the numbers in the tables as
demonstrated and discussed in
class.
- If you have followed the directions,
the number in the cell will be the
percent of the people in a particular social or
economic or political
category who said they voted or did not vote.
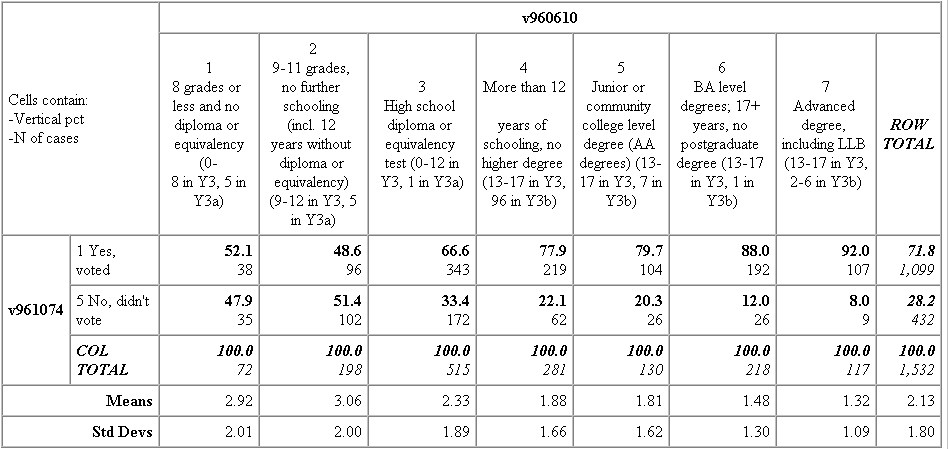
- See the example. (Vote 3)
- Look in column 1, the one labeled "8 grades or less..."
- We see that 72 people are in that
category. (Look in row labeled
"COL TOTAL."
- Of those 72, 38 or 52.1 percent said they
voted; 35 or 47.9 percent
they did not. (Look in the rows "Yes, voted" and "No, didn't vote."
- Now look at the next column, the one
labeled "9-11 grades..."
- There are a total of 198 respondents in that category.
(Look at the
bottom of the column.)
- Of these 198 people, 98 or 46.6 percent claimed
to have voted
while the other 102 said they did not vote.
- You can interpret the other columns in the
same fashion.
- At the "Advanced degree..." end of the
table, 107 of the 117 (or
92.0% of the) respondents voted. That's quite a difference, right!
- Your tables will, of course, look different
and have to be analyzed individually.
- The key to understanding is to ask two questions:
- How many people are in a given category of the first variable?
- How many and what percent of them voted?
- The table should give you both answers.
- You simply have to compare the tables to
see if there is a pattern.
- For example, in the previous case we
see that people with
higher levels of education say they voted more often than do
people with less than a high school diploma.
- You need to look for patterns or generalizations: do
individuals in different categories, on the whole, behave
differently?
- IMPROVING THE ANALYSIS:
- This section separates the children from the adults;
those who don't get the
contract from those who do.
- When you print the final versions of the tables for
your appendix (see below) you
should provide short, crisp labels for the column and row
categories.
- Don't use abbreviations
- But don't simply copy they labels as they appear in the
table since they are
usually too long and cumbersome.
- Combining categories:
- It is perfectly "legal" and proper to combine
variable categories in order to
simplify the analysis.
- For instance, suppose you want a table that shows
the relationship
between income and voting.
- It would be awkward-downright dumb,
in fact-to present a table
with 20 columns, each standing for a particular income category.
- So instead group or gather the columns in"bundles" to make
smaller but clearer, more meaningful tables.
- To pursue the age example, you might create
a category "Less than
$14,000"; another one "$14,000 to $24,999"; another "$25,000 to
$44,999"; and so forth. The final table would have many fewer
tables and would be much easier to read.
- The program makes it particularly easy to do this,
if you pay attention.
- Follow these steps"
- First type the variable number.
- Then a right parenthesis.
- Then the letter "R." (No period)
- Then a range of codes for the first category,
- Then a semicolon.
- Then the next range of codes and a semicolon.
- Continue in this manner until all the ranges have been
entered.
- Then close with a left parenthesis.
- Example:
- I want to group the income variable, v960701, into 5
income categories as follows:
- Less than $14,000
- $14,000 to $24,999
- $25,000 to $44,999
- $45,000 to $59,999
- $60,000 and more
- The command in the horizontal dialog box is:
- v960701(r: 1-8;9-14;15-18;19-20;21-24)
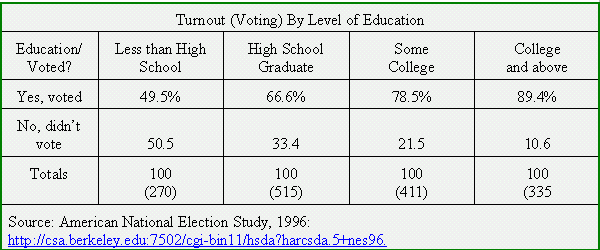
- See the figure that shows income and voting.
The finished
table
is much easier to read and understand. (Vote 6)
- You can recombine by hand.
- But if you do you have to recalculate the percentages.
- Always ask yourself how many people in a category and how many and
what percent of them voted.
- WRITING THE REPORT:
- You have to copy the data in the
computer generated tables into your word
processor.
- It's easiest to just print
the tables and copy them later.
- PRESENTATION;
- Your report, which can actually be quite brief, should contain four parts:
- An introduction in which you state what you are doing and why.
- This section will also cite the data source.
- A section of "interpretative" remarks or analysis.
- Example: "The data indicate that the following types of people vote
less frequently than others and thus perhaps should be targeted for
voter registration and get-out-the-vote drives...."
- It might include one or two tables (or bar graphs) that illustrate the
points.
- A brief conclusion that might discuss what questions are unanswered and
how you, if given the contract, would address them.
- An appendix that contains neatly and completely labeled tables.
- Members of the committee will come here for details.
- They will also be interested to know if the data support your verbal
analysis.
- Suppose, for instance, you say that "highly educated people
vote at a higher rate than those without much education,"
but the table shows only on a 10 percent difference.
- You would have to explain why a 10 percent difference isn't
too important.
- In other words, don't just collect a lot of numbers. Think
about what they "tell" you about the real world.
- Notes on typing tables.
- Don't do them by hand; use a word processor.
- Word processors have table generating features that allow
to produce a tables with a given number of rows and
columns.
- You can then just enter the percentages.
- Example created with WordPerfect.
- Note that the body of the table
just contains percentages,
except the last row, which also shows the column totals or
number of cases.
- You don't need row totals.
- Notice that there are no abbreviations. I've also include a
title and source.
- TIPS:
- Read this carefully because the points awarded
(grade) depend on adherence to the guidlines.
- Check list:
- Are the conclusions consistent with the data?
- Did you write clearly, concisely, and effectively?
- Did you correct grammatical errors and spelling mistakes?
- Are the tables neatly and completely labeled?
- No abbreviations, right?
- Did you include the question wording or describe
the "'variable" so
the reader knows what the column and row categories refer to?
- Did you proof read? There can't be any typos!
- Do you have a typed cover sheet (i.e., title page)
with your name(s) on it?
- Can the Committee get a
hold of you?
- Is the report neatly bounded?

 Go to American Political System page
Go to H. T. Reynolds page