1. INTRODUCTION
In many developing countries rapid urban growth since the mid-twentieth century
has caused much alarm. How to provide employment, housing and public services
to the growing numbers of urban dwellers will undoubtedly remain important problems
for these nations well into the twenty-first century. As countries go through
the process of economic development, a greater percentage of the population tends
to congregate in the capital region in order to take advantage of economic, educational,
political, and cultural resources (Jefferson, 1939; El-Shahks, 1972; and Mehta,
1964). This agglomeration process tends to create a lop-sided form of economic
development that favors the capital region at the expense of the periphery of
the country. In an attempt to alleviate the concentration of population in the
capital region, many developing countries have adopted population redistribution
policies. Since the 1960s, these policies have been implemented with limited
success in such diverse countries as Tanzania (Sawers, 1989), Egypt (Stewart,
1996), South Africa (Dewar, Todes, and Watson, 1986), Peru (Jameson, 1979), Mexico
(Barkin, 1975), Brazil (Semple, Gauthier, and Youngmann, 1972), Thailand (Sternstein,
1979), Taiwan (Williams, 1988), and Indonesia (Firman, 1997).
Probably the most grandiose population redistribution project undertaken during
the mid-twentieth century was in Venezuela. The Venezuelan government used
its oil wealth to create an industrial complex in the southeast to act as a
growth pole to direct population and economic resources away from the overcrowded
metropolis of Caracas. The planned industrial city emerged out of two mining
settlements at the confluence of the Caroni and Orinoco Rivers and grew from
an urban population of approximately 3,500 in 1950 to 453,047 by 1990 (Venezuelan
Census, 1995). Since Venezuela was one of the newly industrializing nations
of the developing world, it was hoped that policies concerning population redistribution
enacted in Venezuela could be appropriately applied to other developing nations
of the world. Unfortunately, social scientists lost interest in the demographic
impact of Ciudad Guayana after the 1970s, as the growth pole philosophy came
under attack by those who believed that deconcentration of population and economic
resources would occur naturally as a country went through the process of economic
development (Richardson, 1984; Oberai, 1993).
There have been no studies that have examined migration flows to and from
Ciudad Guayana on a longitudinal basis. This study attempts to help fill this
void in the literature. This work does not dispute the fact that migration
to Ciudad Guayana increased substantially during the 1960s and early 1970s.
Earlier studies have clearly indicated this to be the case (Rodwin, 1969; Friedmann,
1969).
All data used in the analysis are from the Venezuelan Censuses for 1950, 1961,
1971, 1981, and 1990. Unfortunately, the Venezuelan Censuses did not record
migration flows by city. The lack of these data necessitates an indirect approach
to the migration problem.
The only comparable migration data over the five census years are migration exchanges
between the 23 states of Venezuela. Each census recorded the state of birth and
present state of residence at the time of the census for all individuals who
were born in Venezuela. Henceforth, these individuals will be considered either
life-time in or outmigrants. Foreign-born individuals are not considered in this
study.
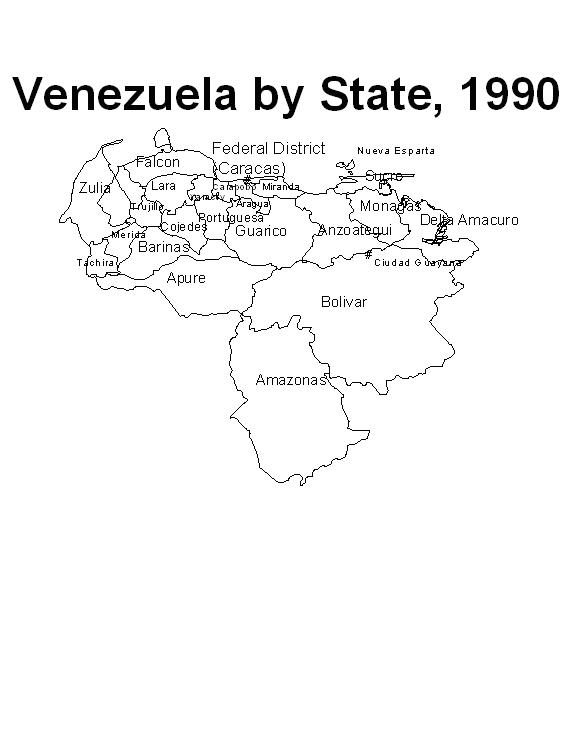
The major focus of the paper is to detect changes in the importance of origin
and destination states of life-time migrants to and from Bolívar State
that may be attributed to the creation of Ciudad Guayana. Instead of focusing
on actual numbers of life-time inmigrants to Bolívar State from the
other 22 states of Venezuela between 1950 and 1990, this paper examines the
percentage of life-time inmigrants to Bolívar State that originated
from each of the other 22 states of Venezuela (Figure 1) in 1950, and the changes
that occurred by 1990. Likewise, the percentage of life-time outmigrants from
Bolivar found in each of the other Venezuelan
Figure 1
 |
states is compared with the percentages for 1990. The argument is that Ciudad
Guayana changed the migrational patterns between Bolívar State and the
remainder of the Venezuelan states over the forty year period. The average
distance traveled by a life-time inmigrant or outmigrant to and from Bolívar
State during this time is also provided as supporting evidence for the shifts
in origin and destinations of life-time migrants to and from Bolívar
State.
Migrant exchange ratios between Bolívar State and the other 22 states
are also examined for the five census years. These ratios compare the number
of life-time inmigrants to outmigrants between Bolívar State and each
of the other Venezuelan states. A figure of 1.0 represents an equal exchange
of life-time migrants between Bolívar State and another state. Figures
below 1.0 represent a loss of net migrants from Bolívar State, while
figures above 1.0 represent a net gain for Bolívar State.
BACKGROUND:
Venezuelas Experience with the Guayana Project:
The general consensus concerning the Ciudad Guayana project was that it failed
in its attempt to divert both migrants and economic resources from the capital
region (Friedmann, 1965; Rodwin, 1969; and Peattie, 1987). Even though approximately
1,000 migrants were streaming into the new city every month as of 1967 (Proctor,
1968), little of the flow originated from the capital region or the overpopulated
rural states of Western Venezuela. The early migrational flows were mostly unskilled
rural migrants from Eastern Venezuela instead of skilled personnel from the capital
region as initially intended (Rodwin, 1965; Friedmann, 1969; Turner and Smulian,
1971). Further spurring the uncontrolled growth of the city was that the majority
of migrants to Ciudad Guayana consisted of families from the surrounding eastern
states, where women maintained some of the highest fertility levels in Venezuela
and likewise continued this behavior once relocating to Ciudad Guayana (MacDonald,
1969).
From an economic perspective, the success of the program was equally discouraging.
Roesler and Azam (1990) claimed that Ciudad Guayana did not achieve its intended
objectives because planners had relied on a unidimensional strategy of development
which entailed only developing the industrial sector at |
the expense of the agricultural sector. The channeling of a great proportion
of economic resources into the industrial sector may have increased production
levels, employment and GNP, but it also led to some negative externalities. A
few examples of problems with this particular development strategy include unmanageable
population growth, income disparities and increased costs of living. According
to Artle (1971) the design of the Ciudad Guayana industrial complex was an unwise
use of resources because manufacturing is a highly capital-intensive operation
and, although the city attracted migrants, there were not enough employment opportunities
to fulfill these needs. Reif (1987) addressed the question as to whether government
policies were effective in the deconcentration of industry away from the Caracas
metropolitan area to Ciudad Guayana. He found that for 1974-1978 the deconcentration
in industry that did occur had little to do with government incentives.
Venezuelan Migration Studies with Reference to Bolívar
State:
Chen (1968) in his study of internal migration in Venezuela was one of the first
to call attention to the fact that the state of Bolívar had switched from
being a state of negative net migration prior to 1950 to one of positive net
migration by the end of the 1950s. Lawson and Brown (1987) found a significant
relationship between the process of industrialization and inmigration rates to
the state of Bolívar in the early 1970s and concluded that Caracas was
less important economically and a less significant destination for migrants than
it had been prior to the 1970s. Brown and Goetz (1987) combined place attributes
with individual attributes in the migration equation to determine the effect
that economic development had on out-migration from particular districts in Venezuela
and found that population pressure and the economic structure of the district,
as well as the educational level of individual migrants, explained approximately
two-thirds of the variance in migration. More importantly, the authors found
that the district containing Ciudad Guayana conformed to the characteristics
for districts housing other major cities, and that by 1971 Ciudad Guayana had
taken its place as a core district in terms of economic development. Brown and
Kodras (1987) found in their analysis of 1971 census data of migration between
rural areas, frontier regions and core regions that, as far as Ciudad Guayana
was concerned, the inmigration flows to the region were migrants who were less
endowed in human capital than the out-migrants moving to the core region. The
researchers admit that this pattern may indeed change as the frontier regions
undergo further development as will be determined by the 1981 and 1990 censuses.
DISCUSSION:
Comparison of Life-Time In, Out, and Net Migration for the Bolívar
State for 1950 through 1990:
Life-time inmigration, outmigration, and net migration for Bolívar State
with the other 22 Venezuelan states are recorded for 1950, 1961, 1971,1981, and
1990 in Table 1. In 1950, Bolívar State had a net life-time migration
loss to the other states of Venezuela of 10,283 individuals. By 1961, Bolívar
State had a net life-time migration gain of 4,860 individuals. The new city of
Ciudad Guayana had just been completed and attracted migrants from the surrounding
states. It is also probable that potential migrants out of Bolívar State
would have also settled in the new city. Net life-time migration gains to Bolívar
State climbed to 56,230 individuals in 1971 and then to 128,118 life-time individuals
by 1981, before leveling off at 157,347 by 1990. One must be extremely cautious
in interpreting these figures. While it is apparent that Bolívar switched
from a net loser of life-time migrants in 1950 to a net gainer of migrants with
every successive decade from 1961 to 1990, one must also consider that Venezuelas
population increased by 259.5 percent between 1950 and 1990 as a result of rapidly
declining death rates (Statistical Abstract of Latin America, 1997), which provided
a tremendous pool of potential migrants. Likewise, Bolívar States pool
of potential life-time outmigrants would be affected by natural increase over
the decades attributed to the flow of migrants into Bolívar State.
TABLE 1. Life-Time In, Out, and Net Migration
for the Bolívar State, 1950-1990.
|
Year
|
Life-Time In
|
Life-Time Out
|
Life-Time Net
|
|
1950
|
15,467
|
25,750
|
-10,283
|
|
1961
|
40,785
|
35,928
|
4,860
|
|
1971
|
103,918
|
47,683
|
56,230
|
|
1981
|
202,452
|
74,334
|
128,118
|
|
1990
|
243,765
|
86,418
|
157,347
|
Source: Compiled from Table 12. Décima Censo de Venezuela. 1975.
Tables 1.7.
Venezuela: XI Censo General de Población y Vivienda. Vols. 1-23. 1981-1986;
and
Table 7. Características Generales. El Censo 90 en Venezuela. Central
de Estadística e Informática. 1995.
The numbers of life-time migrants to and from Bolívar State for each
of the other 22 states of Venezuela from 1950 to 1990 are displayed in figures
2A and 2B.
Figure 2A
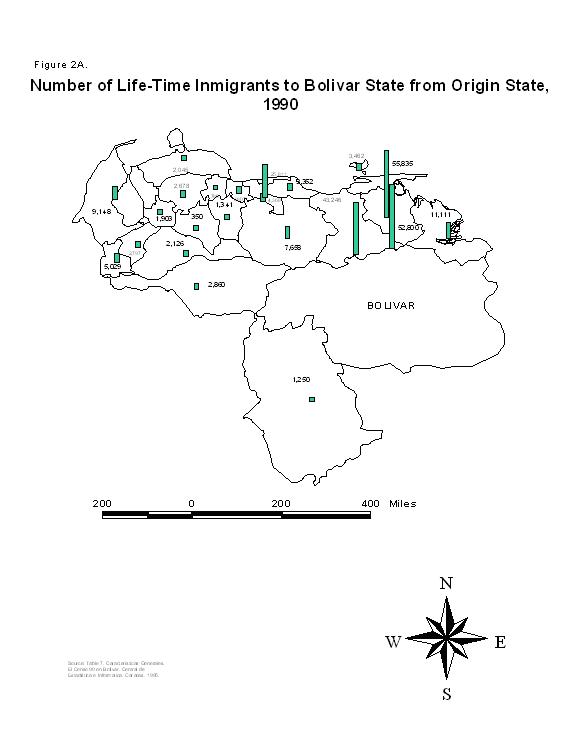 |
Figure 2B
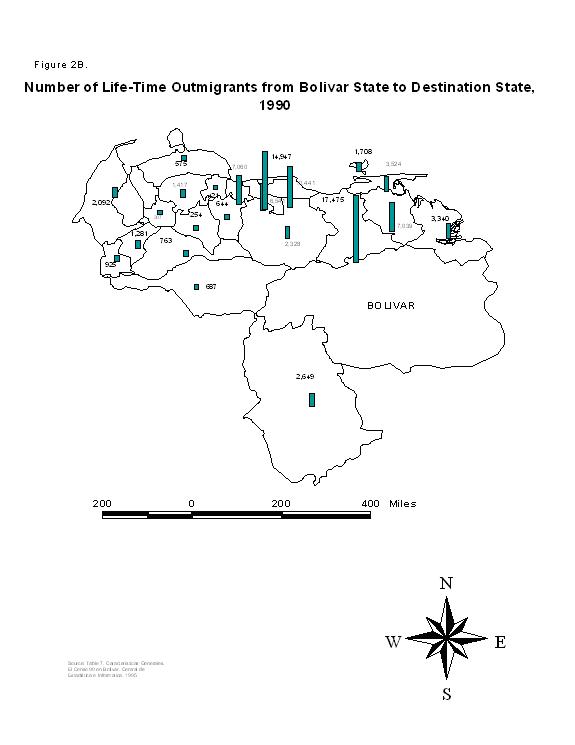 |
The directional bias of life-time inmigrants is obvious, given that the Northeastern
States provided the bulk of life-time inmigrants to Bolívar State. The
western states provided relatively few migrants and this is most likely a result
of the distance between Bolívar State and these states as well as alternative
opportunities that would be available in the capital region. Life-time outmigrants
from Bolívar State as of 1990 were less constrained by distance than
life-time inmigrants and were more represented in the capital region (the Federal
District, Aragua, Carabobo, and Miranda). Average distance traveled by life-time
migrants to and from Bolívar State for the five census years will be
further examined in a another section.
Percentage Distribution of Life-time In and Outmigrants
to and from Bolívar State for 1950 and 1990:
A comparison of the percentage life-time inmigrants to Bolívar State that
originated in the other 22 Venezuelan states is displayed in Table 2 (located
at the end of this section). Over the 1950 to 1990 timeframe, Bolívar
began to pull a greater percentage of its total life-time migrant population
from further afield. One of the most striking examples is that of the Federal
District, which in 1950 provided only 4.5 percent of the total life-time inmigrant
population in Bolívar, whereas by 1990, 10.6 percent of the total life-time
inmigrant flow was from the Federal District. However, the other states of the
capital region, Aragua, Carabobo and Miranda, never sent as many migrants to
Bolívar State as the Federal District did. The 1950 and 1990 percent composition
of total migrants to Bolívar from these three states remained relatively
unchanged. Miranda, Aragua and Carabobo were always more important as a destination
for migrants from Bolívar than vice versa. One of the greatest losers
in the inmigrant flow, in terms of the percentage of life-time inmigrants, between
1950 and 1990, was Anzoategui which contributed 33.9% of all migrants to
Bolívar in 1950 but only 17.7% in 1990. By 1990, Anzoategui had receded
to third place as a source of inmigrants to Bolívar--behind Sucre, 22.9%
and Monagas, 21.7%. Delta Amacuro, Guarico, and Apure were also major losers
in percent composition of the total migrant population between 1950 and 1990.
Apure showed the greatest decline during this four-decade period. In 1950, 5.7
percent of all inmigrants to Bolívar hailed from this state, whereas by
1990 only 1.2 percent were represented in Bolívars life-time inmigrant
population. Guarico also receded from 8.3 percent of the total in 1950 to only
3.1 percent of the total in 1990. Sucre made the biggest gain for it had
only 5.8 percent of the inmigrant total in 1950, which for that year made it
the fifth greatest contributor of migrants to Bolívar, but had become
the number one contributor by 1981 at 23.0 percent of the total. The eight states
of the western highlands did not change much in their percentage contribution
of migrants to Bolívar between 1950 with 7.3 percent of life-time inmigrants
and 1990 with a comparable 7.0 percent of life-time inmigrants. It would appear
that the western highlands as a source region was always outside the migration
field of Bolívar. Zulia contributed only 1.1 percent of life-time migrants
to Bolívar in 1950 but submitted a greater share of migrant population
by 1990, 3.8%, indicating a much greater draw from Zulia than in earlier decades.
In 1950, the Federal District was the destination for almost one third, 32.7
percent, of outmigrants from Bolívar State (figure 2B, table 2), but
by 1990, this figure dropped to only 17.3 percent. The Federal District failed
to remain as attractive to Bolívar-born individuals as it was during
mid-century. At this time, a process known as polarization reversal was occurring
throughout the developing world. For many major cities, inmigration rates had
lessened or in some circumstances reversed so that more individuals were leaving
the major city of the country than entering (Rowland and Gordon, 1996; MacKellar
and Vining, 1995; Villa and Rodríquez, 1996). While the Federal District
was decreasing its share of outmigrants from Bolívar, the three surrounding
states in the capital region were making significant gains. In 1950, Aragua,
Carabobo, and Miranda only held a combined total of 8.2 percent of outmigrants
from Bolívar. By 1990, these same three states held 27.3 percent of
all outmigrants from Bolívar. Though much of the flow of outmigrants
from Bolívar was still directed toward the capital region, it was more
dispersed to the surrounding states of the capital region by 1990 than it was
in 1950. The single greatest destination for outmigrants in 1950, Anzoategui,
with 36.5 percent of the total, receded to second place with 20.2 percent
of the total flow by 1990. Monagas and Sucre became more popular over the 1950
to 1990 period for outmigrants from Bolívar; 4.2 and 0.9 percent respectively
in 1950, compared to 7.1 and 3.2 percent in 1990. By 1990, these two states
were the greatest contributors of inmigrants to Bolívar. It is plausible
that this substantial flow to Bolívar caused a countermigration in the
opposite direction. Such a countermigration would account for the increased
percentages of outmigrants from Bolívar found in Monagas and Sucre by
1990. One of Ravensteins (1885) laws was that every major migration stream
caused a countermigration stream due to the return of unsuccessful migrants
to the origin as well as the migration of individuals from the destination
to this locale due to the increased interaction between the two locales. Since
the census records migration by state of birth, only migrants born in Bolívar,
the origin, would be enumerated in the counterflow to Sucre and Monagas, since
any returned migrants to either Sucre or Monagas would be enumerated as nonmigrants
in the census data. The western highlands proved to be of greater attraction
to outmigrants from Bolívar by 1990 than they had been in 1950. These
eight states were the destination for 2.9 percent of all life-time outmigrants
in 1950, while in 1990, 5.5 percent of migrants from Bolívar were enumerated
in the highlands. It appears that outmigrants from Bolívar have extended
their migration distance during the latter half of the twentieth century.
In summation, an examination of the percentage composition of total life-time
inmigrants for Bolívar State would suggest that by 1990 Bolívar
had drawn migrants from states further away than in the earlier decades of
the study period. Changes in the direction of outmigrants from Bolívar
State to other states in Venezuela between 1950 and 1990 are more difficult
to discern. The next section examines the average distance traveled by a life-time
inmigrant and outmigrant for Bolívar State for the five census years.
TABLE 2. Percentage Distribution of Life-Time In and Outmigrants to
and from Bolívar State, by State, 1950-1990:
| |
IN
|
|
|
|
|
OUT
|
|
|
|
|
| |
1950
|
1961
|
1971
|
1981
|
1990
|
1950
|
1961
|
1971
|
1981
|
1990
|
| Federal District |
4.5
|
5.3
|
5.9
|
9.5
|
10.6
|
32.7
|
36.2
|
35.4
|
22.3
|
17.3
|
| Anzoategui |
33.9
|
26.8
|
24.4
|
20.6
|
17.7
|
36.5
|
26.2
|
18.1
|
19.7
|
21.2
|
| Apure |
5.7
|
2.6
|
1.2
|
1.3
|
1.2
|
3.2
|
2.3
|
7.0
|
0.9
|
0.8
|
| Aragua |
1.5
|
0.9
|
0.8
|
1.4
|
1.8
|
3.3
|
4.3
|
1.4
|
7.7
|
7.6
|
| Barinas |
1.0
|
0.3
|
0.3
|
0.7
|
0.9
|
0.5
|
0.5
|
0.6
|
0.7
|
0.9
|
| Carabobo |
1.5
|
0.9
|
0.8
|
1.2
|
1.6
|
2.1
|
2.7
|
5.6
|
8.3
|
8.2
|
| Cojedes |
0.3
|
0.3
|
0.1
|
0.2
|
0.1
|
0.3
|
0.2
|
0.1
|
0.2
|
0.3
|
| Falcón |
1.6
|
0.9
|
0.9
|
0.7
|
0.8
|
0.7
|
1.1
|
0.4
|
0.8
|
0.7
|
| Guarico |
8.3
|
4.7
|
2.7
|
3.0
|
3.1
|
3.7
|
4.7
|
2.6
|
2.9
|
2.7
|
| Lara |
1.1
|
0.8
|
0.7
|
0.8
|
1.1
|
0.8
|
1.0
|
1.2
|
1.4
|
1.6
|
| Mérida |
1.0
|
0.6
|
0.5
|
0.7
|
1.1
|
0.2
|
0.4
|
0.7
|
1.3
|
1.5
|
| Miranda |
1.7
|
1.1
|
0.7
|
1.2
|
1.4
|
2.8
|
6.9
|
11.0
|
11.3
|
12.1
|
| Monagas |
15.0
|
20.6
|
24.7
|
22.4
|
21.7
|
4.2
|
3.4
|
4.7
|
7.1
|
8.1
|
| Nueva Esparta |
1.9
|
2.2
|
2.2
|
1.5
|
1.4
|
0.2
|
0.2
|
0.4
|
1.4
|
2.0
|
| Portuguesa |
0.3
|
0.2
|
0.3
|
0.4
|
0.6
|
0.4
|
0.5
|
0.8
|
0.7
|
0.7
|
| Sucre |
5.8
|
16.9
|
22.8
|
23.0
|
22.9
|
0.9
|
1.5
|
1.5
|
3.2
|
4.1
|
| Tachira |
1.6
|
1.2
|
0.9
|
1.6
|
2.1
|
0.3
|
0.5
|
0.5
|
0.7
|
1.1
|
| Trujillo |
1.3
|
0.8
|
0.6
|
0.7
|
0.8
|
0.2
|
0.3
|
0.2
|
0.3
|
0.4
|
| Yaracuy |
0.7
|
0.5
|
0.3
|
0.2
|
0.3
|
0.2
|
0.3
|
0.3
|
0.5
|
0.5
|
| Zulia |
1.1
|
1.2
|
1.9
|
2.6
|
3.8
|
2.0
|
2.9
|
2.7
|
2.4
|
2.4
|
| Amazonas |
1.2
|
1.0
|
0.5
|
0.5
|
0.5
|
3.2
|
2.7
|
3.2
|
3.9
|
3.1
|
| Delta Amacuro |
9.0
|
10.1
|
6.9
|
5.8
|
4.6
|
1.9
|
1.2
|
1.5
|
2.3
|
3.9
|
Source: Compiled from Table 12. Décima Censo de Venezuela. 1975.
Tables 1.7 Venezuela: XI Censo General de Poblacion y Vivienda.
Vols. 1-23. 1986; and Table 7. Características Generales. El Censo Noventa
en Venezuela. Central de Estadística e Informática. 1995.
Average Distance Traveled by Life-time In and
Outmigrants to and from the state of Bolívar:
Average distance traveled by a life-time inmigrant/outmigrant to or from Bolívar
State for each census year was determined by multiplying the number of migrants
for each state by the distance in kilometers from the capital of that state to
Ciudad Guayana. Distance between capitals to measure migration flows in Venezuela
has been used by a number of researchers (Levy and Wadyck, 1971; Schultz, 1982).
The data were then summed for all states and then divided by the total number
of life-time inmigrants to determine average distance. The same procedure was
then repeated to determine average distance traveled by life-time outmigrants
from Bolívar State to the other 22 states for the five census years.
In 1950, the average distance traveled by a life-time inmigrant to Bolívar
was 372.8 kilometers (Table 3). This average distance decreased to 323.3 kilometers
for life-time inmigrants to Bolívar as of 1961. The reason for this
dramatic decrease in average migrational distance was due to the attraction
of migrants from adjacent states, who had been spurred by the creation of Ciudad
Guayana (Friedmann, 1969). By 1971, the average distance traveled by a life-time
inmigrant further declined to 312.3 kilometers. By 1981, the average distance
traversed by a life-time inmigrant to Bolívar State increased to 344.8
kilometers, and then to 373.3 kilometers by 1990. As would be expected, as
Ciudad Guayana continued to grow, its attraction to potential migrants expanded
further throughout the country. This process underlies the concept of the gravity
model of social interaction (Zipf, 1946), in which interaction is enhanced
by the population of two entities, but curtailed by the distance between two
entities (Stouffer, 1940).
When applied to this specific migration problem, it is clear that an increase
in the size of Ciudad Guayana (and thus Bolívar State) while distance
remained unchanged would enhance the flow between Bolívar State and other
states. |
TABLE 3. Average Distance Traveled by Life-Time
Migrants to and from
Bolívar State, 1950-1990 (in Kilometers):
| |
IN
|
OUT
|
|
1950
|
372.8
|
489.3
|
|
1961
|
323.3
|
471.2
|
|
1971
|
312.3
|
485.9
|
|
1981
|
344.8
|
479.4
|
|
1990
|
373.3
|
463.8
|
Source: Características Generales.
El Censo de Venezuela. Central de
Estadística e Informática. 1995. |
The average distance traveled by an outmigrant from Bolívar State in
1950 was 489.3 kilometers. In 1961, the average distance traveled by
an outmigrant from Bolívar State declined to 471.2 kilometers. A plausible
reason for this slight decline is that the new city of Ciudad Guayana siphoned
off potential outmigrants from Bolívar State who may have proceeded
to the cities of the Capital Region. In 1971, the average distance traveled
by an outmigrant increased to 485.9 kilometers. By the early 1960s, the growth
of employment opportunities in Ciudad Guayana could not keep pace with the
influx of migrants from surrounding states (Blanco and Ganz, 1969). It is not
unreasonable to assume that individuals in Bolívar State would seek
employment opportunities in the capital region. The average distance traveled
by an outmigrant in 1981 was 479.4 kilometers and 463.8 kilometers in 1990.
Throughout the time period studied, the average distance traveled by an outmigrant
from Bolívar far exceeded that of the average inmigrant to Bolívar
State. This differential was greatest in 1971 (173.6 kilometers). However,
by 1990 the differential between life-time inmigrants and outmigrants was only
90.5 kilometers. Undoubtedly, transportation and communication linkages between
Bolívar State and the other states were improved between 1950 and 1990.
Such linkages may provide a sufficient explanation of the increase in the average
distance of inmigrants to Bolívar State, but they do not adequately
explain the decline in average distance for life-time outmigrants. A number
of factors may account for the decline in distance for life-time outmigrants
from Bolívar State. First, Bolívar-born individuals who left
the state prior to the 1980s for the cities of the capital region may have
returned once the Venezuelan economy experienced a downturn. Secondly, Bolívar-born
individuals who migrated to the capital region may have returned for retirement.
Thirdly, potential outmigrants from Bolívar State may not have been
attracted to the states of the capital region due to the economic slump of
the 1980s.
Migrant Exchange Ratios for 1950-1990:
A migrant exchange ratio is used to determine how equitable in and outmigrant
flows are for a particular entity without using actual numbers (Chan, 1994).
The significance of the ratio is that it allows values to be compared over different
time periods. The migrant exchange ratio is computed by dividing the number of
inmigrants to an entity by the number of outmigrants from that entity. A figure
of 1.00 indicates an equal exchange of migrants between two entities with the
end result 0 net migration for both entities. A figure above 1.00 indicates positive
inmigration for the entity in question, while a figure below 1.00 indicates negative
inmigration for that particular entity.
| The migrant exchange ratios between Bolívar and the other 22 Venezuelan
states, treated as one entity, illustrate the dramatic shifts in life-time
migration between 1950 and 1990 (Table 4). In 1950, Bolívar had a migrant
exchange ratio of 0.60 indicating that it was a state of net life-time outmigration.
Not surprisingly, with the completion of Ciudad Guayana in the early 1960s,
Bolívar switched from a state of net outmigration to one of slight net
inmigration with a migrant exchange ratio of 1.14. By 1971, with a migrant
exchange ratio of 2.18, Bolívar State had twice as many life-time inmigrants
from other states of Venezuela as it had Bolívar-born individuals residing
in the remainder of Venezuela. Bolívar continued to be favored
in net life-time migration exchanges in 1981 (2.72) and 1990 (2.82).
A more detailed picture of migrant exchange ratios between Bolívar
and the remainder of Venezuela can be obtained by disaggregating the exchanges
by state. In 1950 and 1961, a total of ten states had migrant exchange ratios
with Bolívar State below 1.00, indicating that Bolívar lost in
the net migration exchange with these states. By 1971, only six states had
migrant exchange ratios below 1.00. In 1981 and 1990 the number was further
reduced to four states. The Federal District in 1950 received many times the
number of migrants from Bolívar as it sent to Bolívar in return
(0.082). By 1981, the balance had tipped so that Bolívar had more life-time
migrants from the Federal District than vice versa with a migrant exchange
ratio of 1.16. By 1990, there were almost twice as many life-time migrants
from the Federal District in Bolívar, with a migrant exchange ratio
of 1.73, as there were Bolívar-born individuals in the Federal District.
It is likely that a percentage of migrants who left Bolívar in the 1950s,
1960s and 1970s returned to Bolívar or dispersed to the surrounding
states of the capital region. Surprisingly, migrant exchange ratios between
Bolívar and the three surrounding states of the Federal District showed
little change between 1950 and 1990, suggesting that there was not a mere deconcentration
of Bolívar-born individuals throughout the capital region. Anzoategui,
geographically positioned between the capital region and Bolívar, with
a migrant exchange ratio of 0.56 received almost twice as many life-time migrants
from Bolívar as it sent to Bolívar. Migrants from Bolívar
may have proceeded on their trek to the capital region via Anzoategui, which
would most likely have siphoned off some of the migrants. By 1961, the exchange
between the two states was comparable (1.16). The incipient industrial city
of Ciudad Guayana was just beginning to draw migrants from directly across
the Bolívar-Anzoategui border. During the 1970s and 1980s, Anzoategui
was contributing between 2.5 and 3.0 times as many migrants as were being received
from Bolívar. Zulia was another state that underwent a major transformation
in migrant flow. In 1950, Bolívars migrant exchange ratio with Zulia
was 0.33 indicating that Bolívar sent three times as many migrants to
Zulia as it received from Zulia. However, by 1990, Zulia had sent over |
TABLE 4: Life-Time Migrant Exchange Ratios Between
Bolívar State
and the Other States of Venezuela, 1950-1990:
|
|
1950
|
1961
|
1971
|
1981
|
1990
|
| Federal District |
0.08
|
0.17
|
0.36
|
1.16
|
1.73
|
| Anzoategui |
0.56
|
1.16
|
2.94
|
2.85
|
2.47
|
| Apure |
1.07
|
1.30
|
0.39
|
3.79
|
4.16
|
| Aragua |
0.27
|
0.23
|
1.21
|
0.50
|
0.67
|
| Barinas |
1.25
|
0.56
|
1.07
|
2.46
|
2.79
|
| Carabobo |
0.43
|
0.40
|
0.30
|
0.38
|
0.54
|
| Cojedes |
0.74
|
1.75
|
2.06
|
2.09
|
1.38
|
| Falcón |
1.38
|
0.96
|
4.26
|
2.38
|
3.56
|
| Guarico |
1.36
|
1.15
|
2.26
|
2.77
|
3.29
|
| Lara |
0.81
|
0.94
|
1.24
|
1.54
|
1.89
|
| Mérida |
2.58
|
1.62
|
1.57
|
1.59
|
2.18
|
| Miranda |
0.38
|
0.17
|
0.14
|
0.29
|
0.32
|
| Monagas |
2.16
|
6.82
|
11.40
|
8.66
|
7.50
|
| Nueva Esparta |
6.83
|
10.82
|
11.80
|
3.09
|
2.03
|
| Portuguesa |
0.47
|
0.57
|
0.76
|
1.67
|
2.08
|
| Sucre |
3.96
|
12.47
|
32.70
|
19.83
|
15.84
|
| Tachira |
3.49
|
2.77
|
3.64
|
5.79
|
5.44
|
| Trujillo |
4.50
|
3.17
|
5.25
|
6.49
|
6.20
|
| Yaracuy |
1.85
|
2.21
|
1.84
|
1.45
|
1.87
|
| Zulia |
0.33
|
0.46
|
1.53
|
2.97
|
4.37
|
| Amazonas |
0.23
|
0.43
|
0.38
|
0.33
|
0.47
|
| Delta Amacuro |
2.90
|
9.21
|
9.69
|
6.91
|
3.33
|
| |
|
|
|
|
|
| All States |
0.60
|
1.14
|
2.18
|
2.72
|
2.82
|
Source: Compiled from Table 12. Décima Censo
de Venezuela. 1975.
Tables 1.7 Venezuela: XI Censo General de Población
y Vivienda. Vols.
1-23. 1986; and Table 7. Características Generales.
El Censo Noventa en
Venezuela. Central de Estadística e Informática.
1995. |
four times as many life-time migrants to Bolívar as it had received
from Bolívar. It is possible that the downturn of the economy in the 1980s
stimulated
outmigration of individuals from Zulia and at the same time potential outmigrants
from Bolívar, would not be attracted to Zulia (Auty, 1990).
The most inequitable migrant exchange ratios were in 1971 and indicated the
tremendous one-way exchange of life-time migrants between Bolívar and
three states in the northeast, with Bolívar receiving over 32 times
(32.7) as many migrants from Sucre as it sent to Sucre in return. Monagas,
11.4 and Delta Amacuro, 9.69 also had migrant exchange ratios that highly favored
Bolívar. However, the two decades that followed showed a more equitable
exchange between Bolívar and these states; this shift in exchange rate
may be attributed to lower population growth rates in the northeastern states
and perhaps TO return migration of individuals who migrated to Bolívar
during the 1960s.
CONCLUSION:
Bolívar State was transformed from a state of net migration loss in 1950
to a state that had almost three times as many life-time inmigrants as life-time
outmigrants by 1990. This turnaround in migration trends is mostly attributed
to the creation of Ciudad Guayana, an industrial city in a former inaccessible
region of the country. In 1950, 63.7 percent of the inmigrants to Bolívar
State originated from the four northeastern states of Anzoategui, Monagas, Sucre
and Delta Amacuro. The creation of Ciudad Guayana in 1959 stimulated a greater
influx of migrants from these northeastern states than the other states of the
country so that by 1971, 78.8 percent of total life-time inmigrants to Bolívar
originated from these four states. By 1990, a greater percentage of inmigrants
were being attracted from states further away and only 66.9 percent of life-time
migrants originated from the four northeastern states. For example, the Federal
District became a more important source of inmigrants to Bolívar in 1981
and 1990. Whether this dispersal of population can be attributed to Ciudad
Guayana or to a general trend in many developing countries to naturally undergo
deconcentration of population away from the capital city may never be known.
Perhaps the new city of Ciudad Guayana had obtained a population size and economic
structure that allowed it to compete with other cities in Venezuela for potential
migrants.
For destination of life-time outmigrants from Bolívar, the agglomeration
of migrants in the capital region in the 1950, 1961, and 1971 censuses subsided,
so that more migrants were found in other states of the country by the 1981
and 1990 censuses. The concentration of Bolívar-born outmigrants peaked
in 1971 with 53.4 percent of all outmigrants from Bolívar residing in
the capital region and declined to 45.2 percent by 1990. It is likely that
the growth of Ciudad Guayana that was fueled by inmigration and natural increase
as well as the development of the economic base over the 1950 to 1990 period
provided a suitable alternative for potential outmigrants from Bolívar
State by 1981 and 1990.
By using migrant exchange ratios, it was possible to track the in and out
life-time migrant flows between the state of Bolívar and the other 22
states of Venezuela. In 1950, Bolívar lost migrants to ten states, whereas
by 1990, it only lost migrants to four states. Overall, Bolívars migrant
exchange ratio increased with each census. This shift indicates a combination
of three possible scenarios: 1) Bolívar became more attractive to individuals
born in other states; 2) Bolívar became more successful in maintaining
potential outmigrants who were born in Bolívar; or 3) individuals born
in Bolívar returned to their state of birth. Of greater significance,
concerning migrant exchange ratios, is the exchange of life-time migrants between
Bolívar State and the four states of the capital region (the Federal
District, Aragua, Carabobo, and Miranda). In 1950, Bolívar, with a migrant
exchange ratio of 0.13, lost eight life-time migrants to the capital region
for every life-time migrant it gained from the capital region. Although, Bolívar
was never to gain more life-time migrants from the capital region than it sent
to the capital region, by 1990 the migrant exchange ratio was 0.96, indicating
almost an even exchange of life-time migrants between the State of Bolívar
and the four states of the capital region. Given the results of this study,
it appears that social scientists prematurely dismissed the role of Ciudad
Guayana as a growth pole.
Two questions still await definitive answers. Was Ciudad Guayana responsible
for the changes in the source and destination states of migrants to and from
Bolívar State between 1950 and 1990? Was the implementation of the Guayana
Program responsible for the favorable migrant exchange for Bolívar State
between 1950 and 1990? The data suggest that this may be the case. However,
internal migration does not occur in a vacuum. It is quite likely that other
conditions were interacting to affect this relationship, such as the general
increased mobility of individuals once a country proceeds through economic
development.
The latest Venezuelan Census was undertaken in October 2000. It takes several
years to collate the migration data between states and publish the data. The
logical next step is an examination of migrational flows between Bolívar
State and the other Venezuelan States over the 1950 to 2000 period.
BIBLIOGRAPHY
Artle, Roland. 1971. Urbanization and Economic Growth in Venezuela. Papers
of the Regional Science Association. Vol. 27. Pp. 63-93.
Auty, R.M. 1990. Resource-Based Industrialization: Sowing the Oil in Eight
Developing Countries. Clarendon Press: Oxford.
Barkin, David. 1975. Regional Development and Interregional Equity: A Mexican
Case Study. Pp. 277-300. In Latin American Urban Research. Edited by
Wayne A. Cornelius and Felicity M. Trueblood. Sage Publications: Beverly Hills.
Blanco, Roberto Alamo and Alexander Ganz. 1969. Economic Diagnosis and Plans.
Chapter 3 in Planning Urban Growth and Regional Development: The Experience
of the Guayana Program of Venezuela. Ed. Lloyd Rodwin and Associates. The
MIT Press: Cambridge, Massachusetts. Pp. 60-90.
Brown, Lawrence A. and Andrew Goetz. 1987. Development Related Contextual
Effects and Individual Attributes in Third World Migration Processes: A Venezuelan
Example". Demography.Vol. 24, No. 4.
Brown, Lawrence A. and Janet E. Kodras. 1987. Migration, Human Resource Transfers,
and Development Contexts: A Logit Analysis of Venezuelan Data. Geographical
Analysis. Vol. 19, No. 3. Pp. 243-263.
Chan, Kok Eng. 1994. Internal Migration in a Rapidly Developing Country:
The Case of Peninsular Malasia. Malaysian Journal of Tropical Geography.
25(2), Pp. 69-77.
Chen, Chi-Ye. 1968. Movimientos Migratorios en Venezuela. Instituto
de Investigaciones Económicas de la Universidad de Andrés Bello:
Caracas.
Dewar, David; Alison Todes; and Vanessa Watson. 1986. Industrial Decentralization
Policy in South Africa: Rhetoric and Practice. Urban Studies. 23. Pp.
363-376.
El-Shakhs, Salah. 1972. Development, Primacy, and Systems of Cities. The
Journal of Developing Areas.
Pp. 11-36.
Firman, Tommy. 1997. Land Conversion and Urban Development in the Northern
Region of West Java, Indonesia. Urban Studies. Vol. 34(7). Pp. 1027-1046.
Friedmann, John. 1969. The Guayana Program in a Regional Perspective. Chapter
7 in Planning for Urban Growth and Regional Development: The Experience
of the Guayana Program of Venezuela. Ed. Lloyd Rodwin and Associates. The
MIT Press: Cambridge, Massachusetts. Pp. 147-159.
Friedmann, John. 1966. Regional Development Policy: A Case Study of Venezuela.
The M.I.T. Press: Cambridge, Massachusetts.
Jameson, Kenneth P. 1979. Designed to Fail: Twenty-Five Years of Industrial
Decentralization Policy in Peru. The Journal of Developing Areas. 14.
Pp. 55-70.
Jefferson, Mark. 1939. The Law of the Primate City. The Geographical
Review. V. 29. Pp. 226-232.
Lawson, Victoria A. and Lawrence A. Brown. 1987. Structural Tension, Migration
and Development: A Case Study of Venezuela. Professional Geographer.
39 (2). Pp. 179-188.
Levy, Mildred and Walter J. Wadycki. 1971. A Comparison of Young and Middle-Aged
Migration in Venezuela. Annals of Regional Science. Vol. 6. Pp. 73-85.
MacDonald, John Stuart. 1969. Migration and the Population of Ciudad Guayana. Chapter
5 in Planning Urban Growth and Regional Development: The Experience of the
Guayana Program in Venezuela. Pp. 109-125. Edited by Lloyd Rodwin. The
MIT Press: Cambridge, Massachusetts.
MacKellar, F. Landis and Daniel R. Vining Jr. 1995. Population Concentration
in Less Developed Countries: New Evidence. Papers in Regional Science.
74 (3). Pp. 259-293.
Mehta, Surinder K. 1964. Some Demographic and Economic Correlates of Primate
Cities: A Case For Reevaluation. Demography. 1. Pp. 136-147.
Oberai. A.S. 1993. Urbanization, Development and Economic Efficiency. In Third
World Cities: Problems, Policies and Prospects. Eds. John D. Kasarda
and Allan M. Parnell. Sage Publications: Newbury Park. Pp. 58-73.
Peattie, Lisa. 1987. Planning: Rethinking Ciudad Guayana. The University
of Michigan Press: Ann Arbor.
Proctor, N. 1968. Economic Developments in Guayana, Venezuela. Geography.
Pp. 183-186.
Ravenstein, E.G. 1885. The Laws of Migration. Journal of the Statistical
Society. Pp. 167-227.
Reif, Benjamin. 1987. Industrial Deconcentration Policy: Venezuela. Pp.
106-119. In The Economics of Urbanization and Urban Policies in Developing
Countries. Edited by George S. Tolley and Vinod Thomas. The World Bank:
Washington, D.C.
Richardson, Harry W. 1984. Population Distribution Policies. Pp. 262-293.
In Population Distribution, Migration and Development. United Nations:
New York.
Rodwin, Lloyd. 1969. Planning Guayana: A General Perspective. Chapter 1
in Planning for Urban Growth and Regional Development: The Experience
of the Guayana Program of Venezuela. Ed. Lloyd Rodwin and Associates. The
MIT Press: Cambridge, Massachusetts. Pp. 9-39.
Rodwin, Lloyd. 1965. Ciudad Guayana: A New City. In Cities. Alfred
A. Knopf. New York. Pp. 88-104.
Roeseler, Wolfgang G. and Asmaa A. Azam. 1990. Resource Frontier Regions:
Strategic Development Planning and Management: Tennessee Valley (U.S.), Guayana
Region (Venezuela), New Valley (Egypt). Ekistics. V. 57. Pp.319-331.
Rowland, Allison and Peter Gordon. 1996. Mexico City: No Longer A Leviathan? In The
Mega-City in Latin America. Edited by Alan Gilbert. United Nations University
Press: New York. Pp. 173-202.
Sawers, Larry. 1989. Urban Primacy in Tanzania. History of Political
Economy. Pp. 841-859.
Semple, R. Keith; Howard L. Gauthier; and Carl E. Youngmann. 1972. Growth
Poles in Sao Paulo, Brazil. Annals of the Association of American Geographers.
Vol. 62, No. 4. Pp. 591-598.
Schultz, T. Paul. 1982. Life-Time Migration within Educational Strata in
Venezuela: Estimates of a Logistic Model. Economic Development and Cultural
Change. Pp. 559-593.
Statistical Abstract of Latin America. Volume 34. 1997. Editor. James
W. Wilkie. UCLA Latin American Publications: UCLA.
Sternstein, Larry. 1979. Thailand: Migration and Regional Development: The
Khon Kaen Development Centre.
In Migration and Development in Southeast Asia: A Demographic Perspective.
Edited by Robin J. Pryor. Oxford University Press. Pp. 59-68.
Stewart, Dona J. 1996. Cities in the Desert: The Egyptian New-Town Program. Annals
of the Association of American Geographers. Vol 86 (3). Pp. 459-480.
Stouffer, Samuel. 1940. Intervening Opportunities: A Theory Relating Mobility
and Distance. American Sociological Review. Vol. 5. Pp. 845-867.
Turner, Alan and Jonathan Smulian. 1971. New Cities in Venezuela. In The
City in the Third World. Edited by D.J. Dwyer. Harper and Row Publishers,
Inc. : New York. Pp. 237-253.
Venezuela. Dirección General de Estadística y Censos Nacionales.
1969. Noveno Censo General de Población. Vols. 1-22. Caracas.
Venezuela. Dirección General de Estadística y Censos Nacionales.
1974. X Censo de Población y Vivienda: Venezuela, Resumen General. República
de Venezuela, Ministerio de Fomento. Caracas.
Venezuela. Dirección General de Estadística y Censos Nacionales.
1958. Octavo Censo General de Población. Vols. 1-23. Caracas.
Venezuela. Oficina Central de Estadística e Informática. 1986.
Venezuela: XI Censo General de Población y Vivienda. Vols. 1-23. Caracas.
Venezuela. Oficina Central de Estadística e Informática. 1995.
Características Generales. El Censo 90 en Venezuela. Vols. 1-23. Caracas.
Villa, Miguel and Jorge Rodríquez. 1996. Demographic Trends in Latin
Americas Metropolises, 1950-1990.
In The Mega-City in Latin America. Edited by Alan Gilbert. The United
Nations University Press: New York. Pp. 25-52.
Williams, Jack E. 1988. Urban and Regional Planning in Taiwan: The Quest
for Balanced Regional Development. Tijdschrift voor Econ. En Soc. Geografie.
79 (3), Pp. 175-187.
Zipf, George Kingsley. 1946. The P1P2/D Hypothesis: On the Intercity Movement
of Persons. American Sociological Review. Vol. 11. Pp. 677-686.
|