
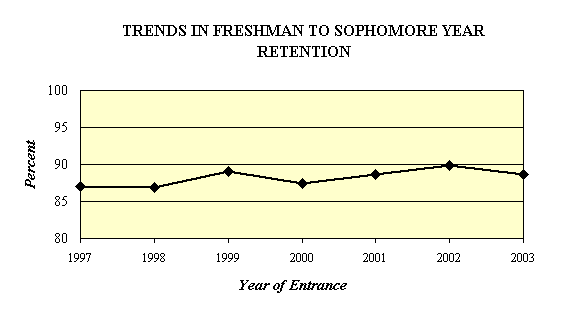
RATE OF ATTRITION BY YEAR OF ENTRANCE
NEW FRESHMEN OF FALL 1997 - 2003
| 1997 | 1998 | 1999 | 2000 | 2001 | 2002 | 2003 | |
| Total # of Freshmen | 3,180 | 3,545 | 3,513 | 3,128 | 3,358 | 3,400 | 3,433 |
| % Attrition by 2nd Fall | 13.0 | 13.1 | 11.0 | 12.5 | 11.4 | 10.1 | 11.4 |
| % Attrition 2nd-3rd Fall | 7.7 | 7.1 | 7.3 | 6.8 | 6.8 | 5.6 | - |
| % Attrition 3rd-4th Fall | 1.8 | 1.3 | 2.3 | 1.5 | 1.2 | - | - |
| Cumulative % Attrition (1st to 4th Fall) |
22.5 | 21.5 | 20.6 | 20.8 | - | - | - |
Note: All entering new freshman cohorts adjusted to comply with IPEDS Graduation Rate Survey Definitions.
Source: Office of Institutional Research & Planning