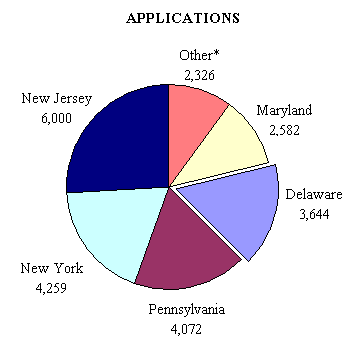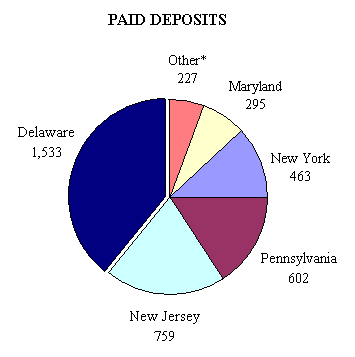
DISTRIBUTION OF TOTAL ADMISSIONS APPLICATIONS AND PAID DEPOSITS
FIRST-TIME FRESHMEN AND TRANSFER STUDENTS FROM SELECT
REGIONAL STATES
FALL 2004
| STATE | APPLICANTS | % OF TOTAL* |
STATE | DEPOSITS | % OF TOTAL* |
|
| New Jersey | 6,000 | 26.2% | DELAWARE | 1,533 | 39.5% | |
| New York | 4,259 | 18.6% | New Jersey | 759 | 19.6% | |
| Pennsylvania | 4,072 | 17.8% | Pennsylvania | 602 | 15.5% | |
| DELAWARE | 3,644 | 15.9% | New York | 463 | 11.9% | |
| Maryland | 2,582 | 11.3% | Maryland | 295 | 7.6% | |
| Massachusetts | 826 | 3.6% | Massachusetts | 85 | 2.2% | |
| Connecticut | 804 | 3.5% | Connecticut | 85 | 2.2% | |
| Virginia | 561 | 2.5% | Virginia | 47 | 1.2% | |
| District of Columbia | 135 | 0.6% | District of Columbia | 10 | 0.3% | |
| * TOTAL | 22,883 | 100.0% | * TOTAL | 3,879 | 100.0% |
* NOTE: Total refers to applications and deposits from these nine states only.
 |
 |
Source: Office of Admissions