Message on a float
Robert McCarthy |
 |
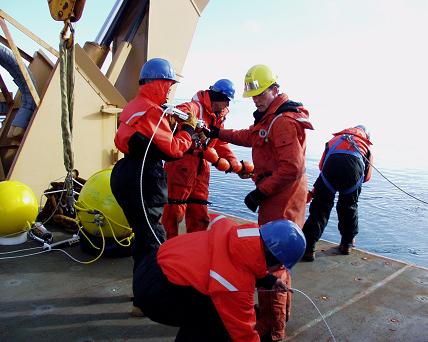
Yesterday and today the scientists and crew were deploying acoustic current meters. But the fun stuff for the on-lookers (scientists and crew alike) was to write a message on the float. This yellow float will bring the current meter to the surface, and hopefully the messages left behind yesterday and today will remain. Some signed their names; others left short messages to fellow scientists and crew, while still others left messages to family members far away. I fell into the latter category. Being away from my family for 4 weeks was a tough decision to make, and I feel for the crew who are away 6 to 9 months of the year. The scenery is spectacular, and every day I think how lucky I am to be here on this cruise. But my family is always on my mind. So this picture is for them. (Fig 1) |
| Besides leaving messages, Helga Schaffrin and Dr. Helen Johnson decided to name each float after a cat. Why not a walrus or a seal or a whale? The answer is the cruise expedition title, “Canadian Archipelago Throughflow Study”, CATS for short. Naming 26 different cats is quite a feet in itself, and by their coaxing, I drew a few pictures on the floats. |
 |
 |
Now for the science. On the July 24 log entry, I told how Dr. Muenchow was excited to see evidence of the Labrador Coastal Current on his computer screen. Well that data came from the ship’s underway acoustic Doppler current profiler (ADCP). This is mounted on the ship’s hull, and measures the current’s horizontal and vertical components at discrete depths. Here they’re averaging the 3-D structure in 15 m “bins” in the vertical direction. Well the same type of instrument is mounted to the top of the yellow floats that are anchored to the ocean bottom. (Look at the blue discs in the upper right on fig 1.) The only problem, instead of receiving immediate data, these bottom ADCP’s store their information for retrieval at a later time. So once the data is recovered, then the data processing will begin in an effort to quantify the amount and variability of flow through Nares Straight. And why is this important? |
| Because the Arctic Ocean has many freshwater sources, including riverine input, excess precipitation over evaporation, freshened seawater input through the Bering Strait, and flow of relatively fresh seawater through the Barents Sea from the Norwegian Coastal Current. All these sources get stirred up in the Arctic Ocean before returning to the North Atlantic as freshened seawater and ice flows through the eastern side of Fram Strait and through the Canadian Archipelago. But these sources have changed over time. Diminishing ice cover and changing precipitation patterns seem to be connected to changing atmospheric patterns that could be felt around the world. A freshening of the Arctic outflow into the North Atlantic could slow the global meridional overturning of the oceans, thereby effecting global atmospheric weather patterns. So by measuring the flow through Nares Straight, these scientists can quantify the amount of flow, and try to determine the major forces driving this flow. |
 |
More moorings
Gerhard Behrens |
| Nothing fancy today, just more moorings. Remember, a mooring is a piece of ocean measuring equipment that stays in the water. But, today’s moorings are different than yesterday. |

The CTD mooring strung out on the aft deck. |

Building another CTD mooring on the deck. |
This kind is a long, long string of things. At the bottom is a weight to hold it on the ocean floor. The electronic tool that lets go of the weight when the scientists want the whole thing back follows the weight. A big float goes next. It will bring the whole thing to the top. On top of the big float is a string of measuring tools and more floats. At the top is a final float and the peeps, the electronic tool that signals where the mooring is. |
| The scientists are measuring salt, temperature, and the pushing force of the water. In oceanography language, you would say: salinity, temperature, and pressure. Take a look at the diagram to see how the mooring is put together. The mooring technicians must follow these directions. Then, look at the pictures to see how everything is lined up before it is placed over the stern. The mooring technicians start with the top, and the last thing to go over the edge is the weight and biggest float. |

Chris Moser with another completed mooring. Now what? |
Carefully put the mooring overboard. |
The scientists will come back for this string of equipment in the spring of 2005. You can imagine how the scientists could worry about their moorings. A piece of equipment could stop working, the sea water could corrode something, or an iceberg could rip it away. |
| Check out the Fun Facts link to learn more about icebergs or sea ice. Yup, they are different! |

The last part to go in is the big float, a release tool, and a weight. |

The diagram that tells how to build the mooring |

Ron Lindsay programs the equipment. |

Bob McCarthy decorates a float with a cat. |

Pete Gamble, the maestro of moorings. |