DEPARTMENT OF POLITICAL SCIENCE
AND
INTERNATIONAL RELATIONS
Posc 150
Assignment No. 1
See below for your specific assignment.
THE ANALYSIS OF PUBLIC OPINION

Read the Instructions very carefully
At the beginning of the semester
we saw that political parties and politicians frequently
make judgements about the political ideology of
the American people, and they sometimes see
significant changes in voters underlying political
philosophy. I also argued that these judgments
about change may be mistaken, that the electorate
may in fact exhibit more consistency than
election results would suugest. Hence,
the fact that Ronald Reagan, an avowed conservative
("classical liberal"), won the presidency
twice by landslides did not necessarily mean
that the public had become more conservative. Nor
did the Republican triumph in the 1994
congressional elections signal a swing toward
conservatism.
Note, in addition, that George W. Bush's 2000 presidential campaign
has stressed the need to keep government from
getting too big and expensive. He repeatedly
criticized his opponent, Al Gore, for proposing
large increases in government spending. Bush's
message was that government should be scaled back.
More important, he implied that he would hold the
line on spending, perhaps even cut some programs
and reduce waste in others. He said again
and again "I trust the people. So let's let them
have a tax break so that they can decide
how they want to spend their money."
This position implied that Bush favored
reductions in most government programs,
except perhaps defense and education and
rested on the assumption that Americans wanted
less government.
But do they? Has the public
changed ideologically?
In the end whether or not the public is becoming more or
less conservative is an empirical question, one that only
be answered by looking a data like public opinion
polls.
You can test or investigate the various
propositions by analyzing shifts (or lack of change)
in public opinion. Doing so requires
examining data from a reliable source.
Perhaps the best source is the "General Social
Survey." It's a poll
that has been conducted yearly since the
early 1970s by the
National Opinion Research Center (NORC) at the
University of Chicago.
You can use these surveys to show how
attitudes toward various government programs,
have changed, if indeed they have changed at all.
-
OVERVIEW:
- You need to find public opinion data.
- The data should show how the public's
opinion about the role in government have changed
in the last 30 years.
- Once you have this information you can
make tables or graphs that show trends
in opinion over time.
- This information can then be used in
a brief (one or two paragraph) report.
- DATA:
- Go to the
General Social Survey
web page as indicated in the
notes.
- You will now be at a
site that contains the General Social Survey, an "poll"
of American public opinion on a variety of attitudes and issues.
- Note that these are the very data that many scholars use.
- On the left
find and click on "Collections."
- When the new page
loads click on "Variables by Year" (Each rounds set
of variables.)
- You'll see a list of years. Click on 1974.
- Scroll down until you find the variable names and labels starting with N.
- Make sure you clicked on 1974.
- Find the variables:
- NATAID Foreign aid
- NATARMS Military, armaments, and defense
- NATCITY Solving problems of big cities
- NATCRIME Halting rising crime rate
- NATDRUG Dealing with drug addiction
- NATEDUC Improving nations education system
- NATENVIR Improving, protecting environment
- NATFARE Welfare
- NATHEAL Improving, protecting nations health
- NATRACE Improving the conditions of blacks
- NATSPAC Space exploration program
- You want to get the data for each year. To do follow these steps.
- First click on NATAID.
- A new browser window should open.
- Look at the top of the second window. You'll see the question and some
beige tabs at the top.
- Copy the question wording at the top.
- Tip: Use the cut and paste features of your computer to copy the
question wording to a word processor or Notepad.
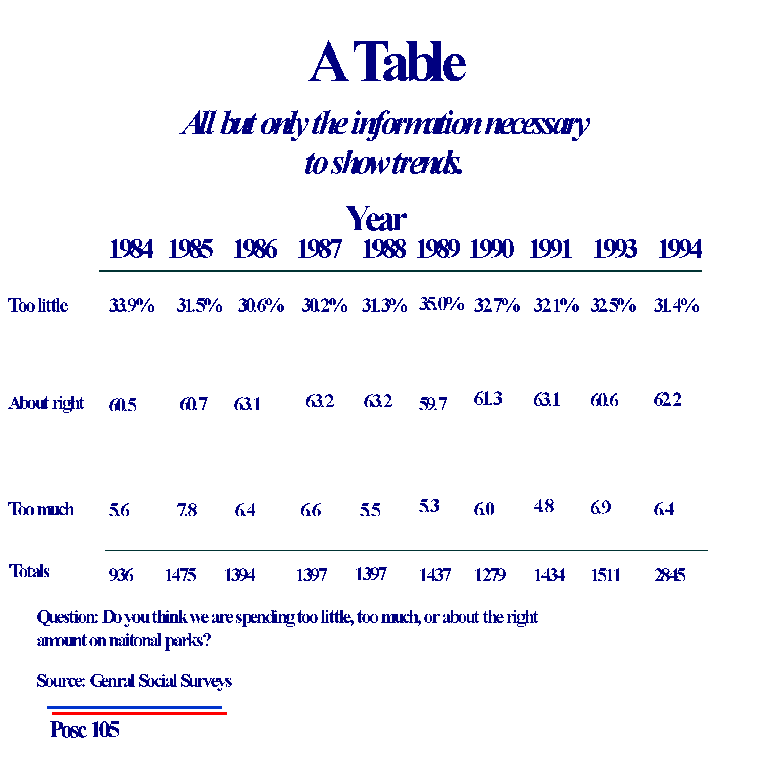
- Each table or graph that you submitt should contain the
question wording. Don't omit this crucial step.
- As an example, here is the question wording for NATAID that we clicked
on above:
"We are faced with many problems in this country, none of which
can be solved easily or inexpensively. I'm going to name some of
these problems, and for each one I'd like you to tell me whether you
think we're spending too much money on it, too little money, or
about the right amount. Are we spending too much money, too little money, or
about the right amount on...Foreign aid."
- As noted,
copy or cut and paste the question wording.
- Make sure that the appropriate question wording appears with each graph.
- Now, click on the "Trends" tab at near the top of the window.
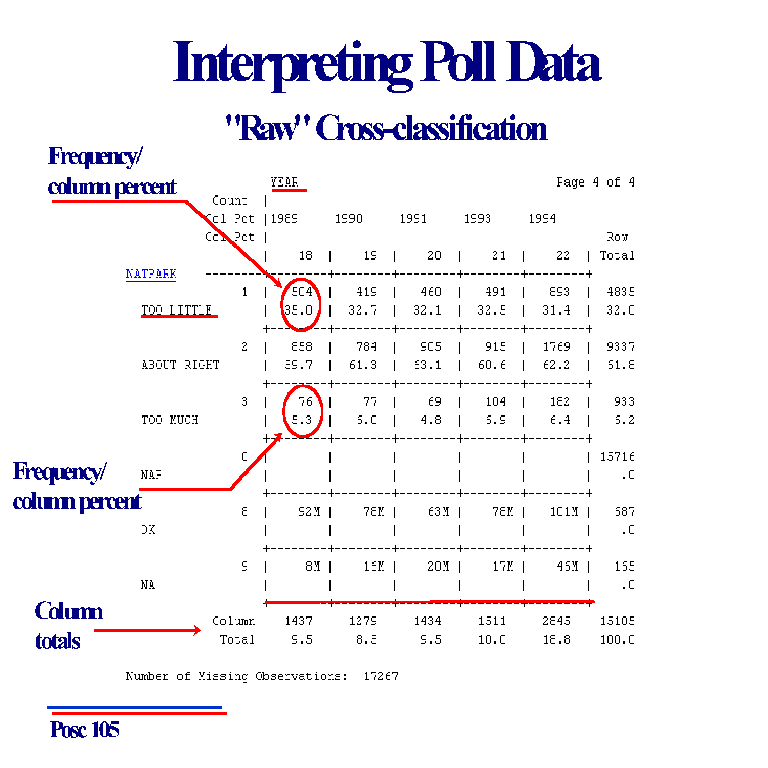
- You'll find a "crosstabulation" of the answers to the question by year.
- Here's what(part of) it (the crosstabulation looks like.>

- ANALYSIS:
- The table lists years along the top as column labels
and responses to a question down the side as row labels.
- For each variable obtain the
raw cross-classification that relates percentages to years.
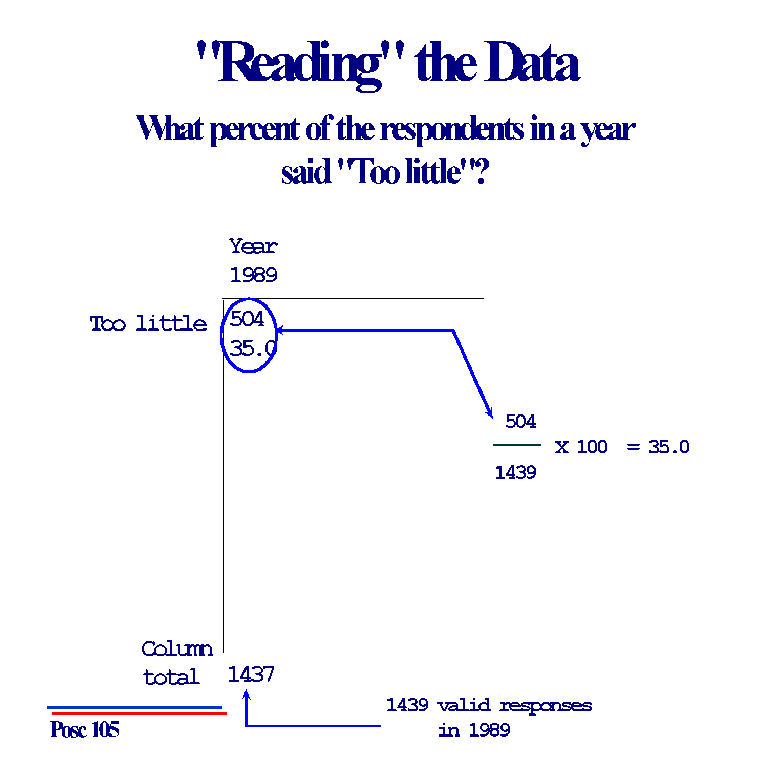
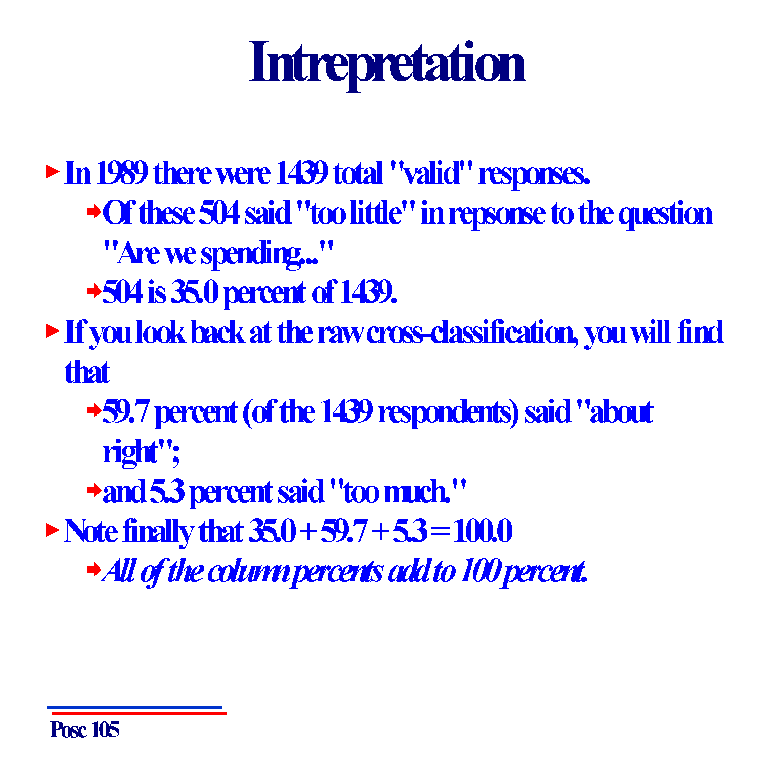
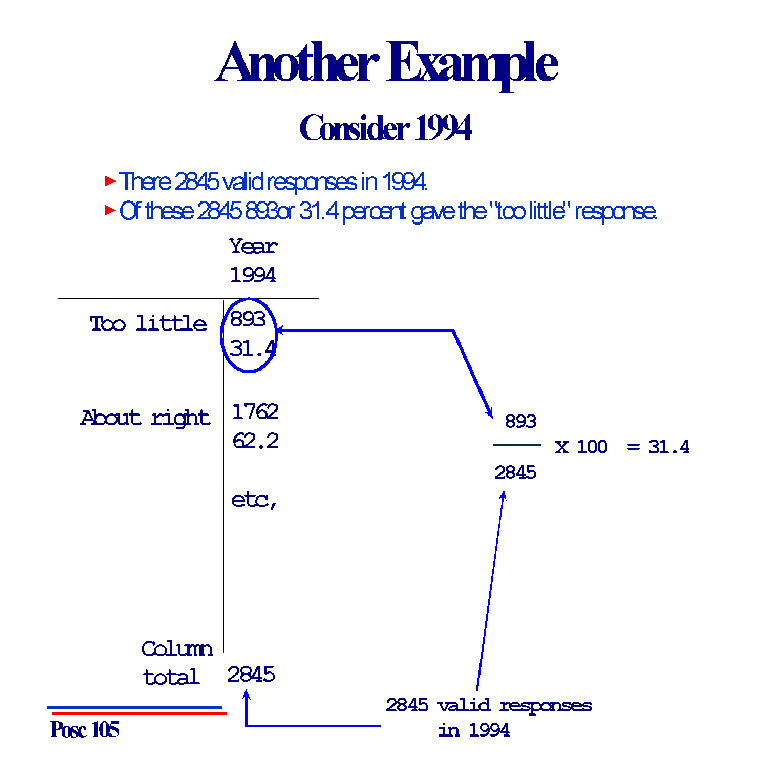
- Make sure you understand how to read the data
that appear in the table.
- Each entry tells you the
percent
of the respondents in a year who
gave a particular response.
- Another example
- You have to scroll down and across the
page to see all of the data, since the
tables are too big to fit on one screen.
- COPY OR PRINT THE ENTIRE TABLE
- ASSIGNMENT:
- If your last name begins with a letter betweeb A and H, do tables
for these variables or questions:
- NATAID Foreign aid
- NATARMS Military, armaments, and defense
- NATCITY Solving problems of big cities
- NATCRIME Halting rising crime rate
- If your last name begins with a letter betweeb I and M, do tables
for these variables or questions:
- NATDRUG Dealing with drug addiction
- NATEDUC Improving nations education system
- NATENVIR Improving, protecting environment
- NATFARE Welfare
- If your last name begins with a letter betweeb N and Z, do tables
for these variables or questions:
- NATFARE Welfare
- NATHEAL Improving, protecting nations health
- NATRACE Improving the conditions of blacks
- NATSPAC Space exploration program
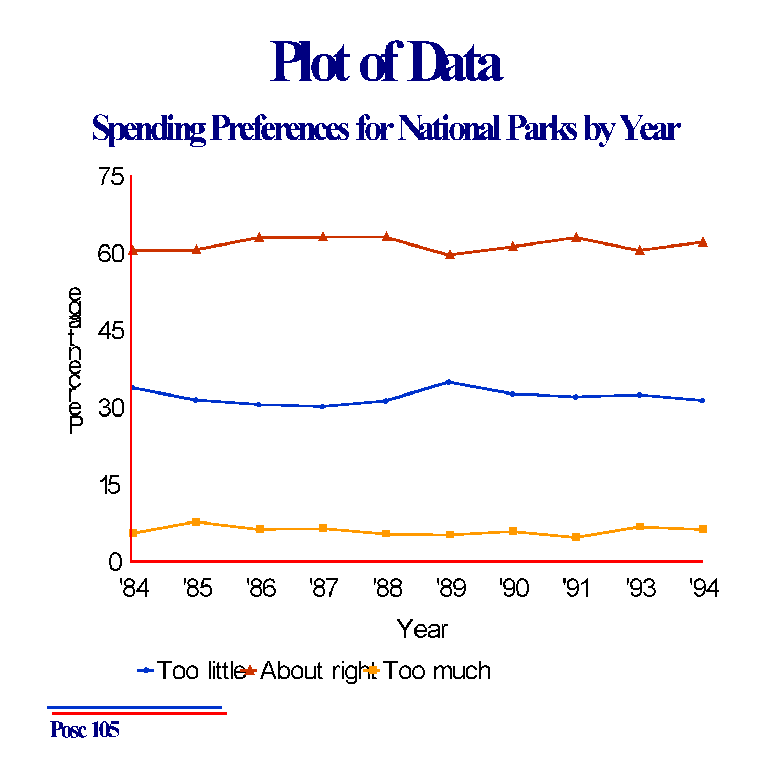
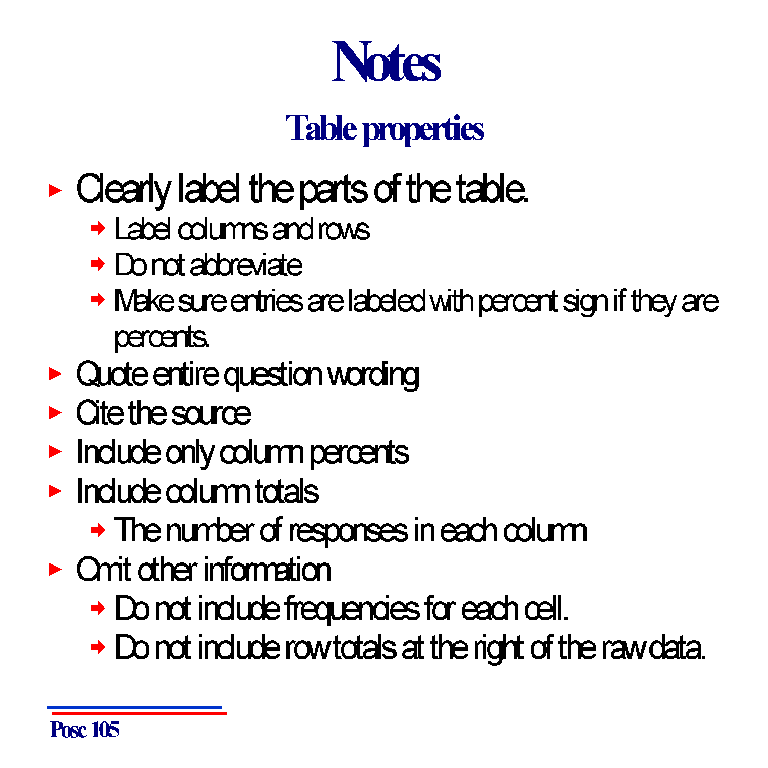
PRESENTING THE DATA:
- Again follow the ideas discussed in class.
- You can use either a
table
or a plot (graph)
to display the data.
- Since there is more than one question
or variable, you will actually need
several tables or graphs, one for each item.
- Use either graphs or plots, not both.
- In order to make
neatly labeled
tables you'll have to use a word processor
such as Word or WordPerfect.
- A good table labels all variables (questions)
completely, no abbreviations and all
row and column headings, again completely.
- The percentages in the table should add
to 100% down each column.
- The last row of the table should contain
the marginal totals. The marginal
totals are the number of cases in each column.
- The data source should be included in an
appropirate citation.
- To make a
nice plot
you will have to
use a program such as a spread sheet (e.g.,
Excel) or some statistical package that can draw graphs.
- DO NOT PRESENT
HAND WRITTEN OR DRAWN RESULTS.
FINAL REPORT:
- Submit a brief (two-paragraphy) report that
- answers the questions
- Does the public seem willing to
cut domestic and foreign aid
programs?
- Has its opinions changed
significantly in the last 20 years or so.
- The paper should includes the neatly typed and presented tables or graphs.
- The
assignment due April 11, 2002 (in class).
- Counts 5 points.
TIPS:
- Make sure the conclusions are consistent with the data.
- Check your work for neatness and clarity.
- There can't be any typos
SUMMARY OF RULES
- I make all judgments about grades. To obtain full credit
you have to produce an outstanding report or proposal. A
paper that just "covers the ground" will earn a satisfactory
grade such as a C- to C+. Thus, if you want more than
just a couple of points, put some thought and effort into
the assignment.Turning in a lot of graphs or tables won't necessarily
guarantee anything. You should make sure that your
data support your conclusions and vice versa.
-
Due April 11, 2002 in class.
- Report must be typed.
- No handwritten or drawn figures, tables, or graphs.
- Name and student number typed.
- Your name on the report means you give your word of
honor that you worked alone.
 Go
to American Political System page
Go
to American Political System page
Go
to H. T. Reynolds page
Copyright © 1999, 2000 H. T. Reynolds
This Home Page was created by
WebEdit,
Friday, February 26, 1999
Revised March 13, 2002