 Office of Institutional Research
Facts and Figures
Table of Contents


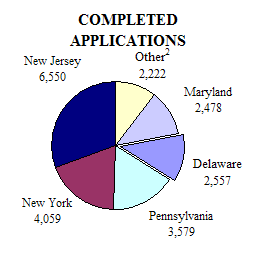
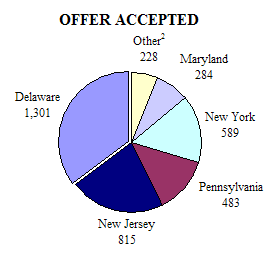
DISTRIBUTION OF COMPLETED ADMISSIONS APPLICATIONS AND ACCEPTED OFFERS
FIRST-TIME FRESHMEN FROM SELECT REGIONAL STATES
Fall 2008
| STATE | COMPLETED APPLICATIONS |
% OF TOTAL1 |
STATE | OFFER ACCEPTED |
% OF TOTAL1 |
|
|---|---|---|---|---|---|---|
| New Jersey | 6,550 | 30.5% | DELAWARE | 1,301 | 35.2% | |
| New York | 4,059 | 18.9% | New Jersey | 815 | 22.0% | |
| Pennsylvania | 3,579 | 16.7% | Pennsylvania | 589 | 15.9% | |
| DELAWARE | 2,557 | 11.9% | New York | 483 | 13.1% | |
| Maryland | 2,478 | 11.6% | Maryland | 284 | 7.7% | |
| Massachusetts | 835 | 3.9% | Massachusetts | 91 | 2.5% | |
| Connecticut | 806 | 3.8% | Connecticut | 72 | 1.9% | |
| Virginia | 487 | 2.3% | Virginia | 56 | 1.5% | |
| District of Columbia | 94 | 0.4% | District of Columbia | 9 | 0.2% | |
| TOTAL1 | 21,445 | 100.0% | TOTAL1 | 3,700 | 100.0% |


1 Total refers to applications and accepted offers from these nine states only.
2 Includes students with Delaware addresses who do not meet residency requirements.
3 Other includes Connecticut, Massachusetts, Virginia, and the District of Columbia.
Source: Office of Institutional Research/UDEW