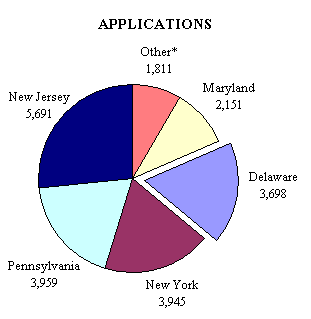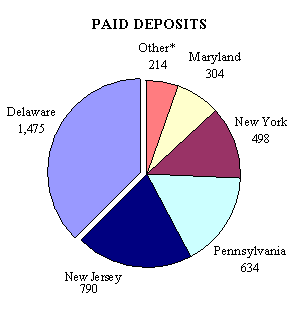
DISTRIBUTION OF ADMISSIONS APPLICATIONS AND DEPOSITS
FIRST-TIME FRESHMEN AND TRANSFER STUDENTS FROM SELECT
REGIONAL STATES
FALL 2002
| STATE | APPLICANTS | % OF TOTAL* |
STATE | DEPOSITS | % OF TOTAL* |
|
| New Jersey | 5,691 | 26.8% | DELAWARE | 1,475 | 37.7% | |
| Pennsylvania | 3,959 | 18.6% | New Jersey | 790 | 20.2% | |
| New York | 3,945 | 18.6% | Pennsylvania | 634 | 16.2% | |
| DELAWARE | 3,698 | 17.4% | New York | 498 | 12.7% | |
| Maryland | 2,151 | 10.1% | Maryland | 304 | 7.8% | |
| Connecticut | 739 | 3.5% | Connecticut | 72 | 1.8% | |
| Massachusetts | 528 | 2.5% | Virginia | 67 | 1.7% | |
| Virginia | 466 | 2.2% | Massachusetts | 65 | 1.7% | |
| District of Columbia | 78 | 0.4% | District of Columbia | 10 | 0.3% | |
| * TOTAL | 21,255 | 100.0% | * TOTAL | 3,915 |
100.0% |
* NOTE: Total refers to applications and deposits from these nine states only.
 |
 |
Source: Office of Admissions