The main purpose of this lab is to get you ready to do project 1.
To see what project 1 is all about, check out some of the work of students who have completed this project previously. Check especially the "proj1" links, on this page, and go to each individuals drawing (e.g. drawKylesPicture.png, drawBrittsPicture.png, drawSonamsPicture.png, etc.)
http://www.udel.edu/CIS/181/pconrad/04F/class.html
In project1, you'll be writing C++ programs that generate line drawings such as these that can be posted to the web. Labs03 and 04 are preparation to get you ready to do this project.
By the time you finish (lab03, lab04, and project 1), you'll have demonstrated your ability to:
You'll also acquire the following skills:
Using gnuplot to create graphics.
Controlling the creation of gnuplot files and data file for gnuplot from a C++ program.
this font). Note that the part that says "/home/usra/d9/55560" will be different for you; it will be the number associated with your home directory.> cd ~/public_html/cisc181 |
> mkdir -p ~/public_html/cisc181 > |
> emacs index.html |
> emacs index.html & |
<html>
  <head>
    <title>Joe Sample's Web page</title>
  </head>

  <body>
    <h1>Joe Sample's Web page</h1>

   <p> I had to do this <b>web page</b> for my
   <a href="http://copland.udel.edu/~pconrad/cisc181"> CISC181 class,</a> Section 012.  Right now it is
    pretty lame, but I hope to make it better later.</p>


  </body>
</html>
|
> chmod 711 ~ > chmod -R 755 ~/public_html |
In this exercise, you will use a program called gnuplot to draw letters of the alphabet. This exercise, together with some future labs, illustrates some of the basic ideas behind how "fonts" work in systems such as Microsoft Windows, Macintosh OS, and the X Windows system used on strauss.
This exercise will begin to teach you what you need to know about gnuplot.
In this exercise, you will first use a text editor (vi or emacs) to create a file that contains points that draw a letter of the alphabet. You will then use gnuplot to plot those points, and store the resulting graphic in an output file. The output file has the extension .png, which stands for "Portable Network Graphics". Files ending in .png are similar to files ending in .gif, .jpg, or .jpeg, except they use a different format for representing the pixels in the image, and for compressing those pixels.
This exercise also assumes you know how to put files on the web under your public_html directory, use the chmod command to make those files readable, and point your web browser at those files.
The suggested link for putting the files you create with this exercise is:
http://copland.udel.edu/~userid/cisc181/lab03where userid is your strauss userid. Hence, the directory name is:
~/public_html/cisc181/lab03
Note that you should NOT put C++ code in a directory under your ~/public_html/cisc181/lab03 directory. That code goes into ~/cisc181/lab03, which is a different directory.
Make special note of the difference. Points may be deducted if you end up with your C++ files visible on your web page.
Gnuplot offers us an easy way to generate graphics from C++ programs. In future labs, we'll be generating data files using C++ programs, and then using Gnuplot to visualize that data.
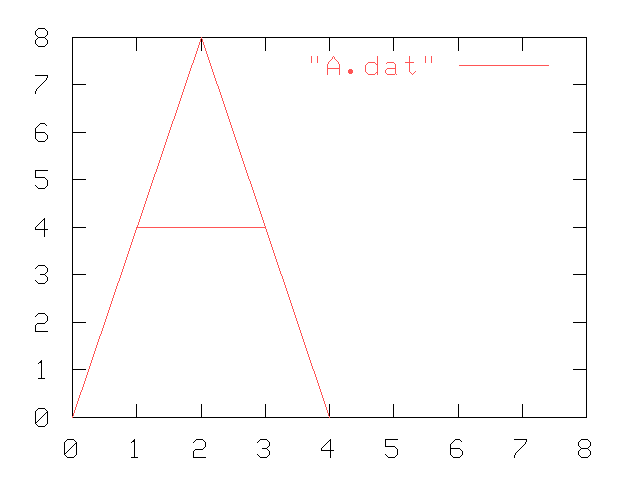
A typical gnuplot data file consists of lines of text, where on each line there are two numbers, representing an (x,y) coordinate. Here is a gnuplot data file called "A.dat", followed by an explanation of its contents:
# A 0 0 2 8 4 0 1 4 3 4 |
set xrange [0:8] set yrange [0:8] set output "A.png" set terminal png large color plot "A.dat" with lines |
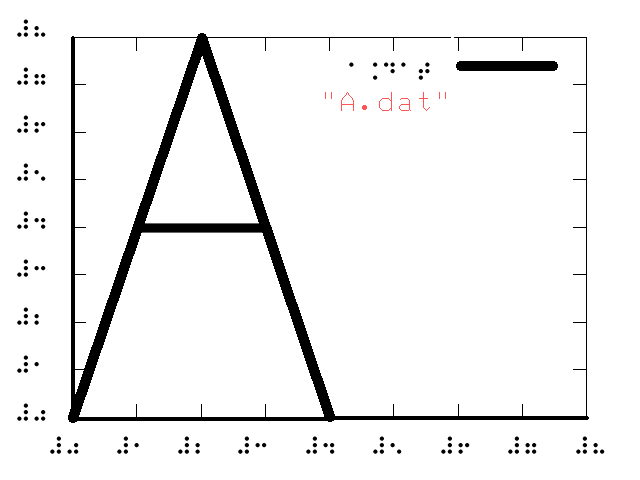
A braille version suitable for printing on tactile paper is also available.
set xrange [0:8] signifies that the x-axis will run from 0 to 8. The set yrange command is similar. set output "A.png" means that the output graphics will go to a file called "A.png". You could supply any other file here that you wish, though it should end with .png if you want it to work properly with your browser. set terminal png large color means that we want .png output. (Note: There are other kinds of output that gnuplot can produce, but we won't need to know about those for this exercise.) plot "A.dat" with lines means to get the data points from the file called "A.dat", and connect the dots with lines. There are other kinds of plots that gnuplot can do, but we won't need to know about those in this exercise. gnuplot A.gnuplot
Then, to see the file, copy it into a directory on your webpage (i.e. somewhere under your ~/public_html directory tree) and do the "chmod" command that makes it readable. You should then be able to point your web browser to the file and see the output.
Sometimes setting the xrange and yrange commands in the gnuplot file to [-1,8] works better than [0,8]; when you go from -1, the xaxis and yaxis don't cover up part of your letter, and its sometimes easier to see what is going on. Experiment with changing the value from 0 to 1 to see what happens when you repeat the gnuplot command, and copy the resulting .png file to your webpage and refresh.
You will also see another set of three files. The CIS.dat file and CIS.gnuplot files can be used to produce a CIS.png file. However, note that if you look at the CIS.png file (by pointing a web browser to that file) the S in CIS is incomplete. As an exercise, see if you can modify the points in CIS.dat to make the S complete, and get the correct graphic to come up. That will help check your understanding of how gnuplot works before you go to the next step.
Finally, there is a similar set of files: V.dat, V.gnuplot and V.png if you want to see one more example.
Create a data file called initials.dat that contains the points needed to print your first and last initial. Create each using block capital letters. Put your first initial in a box where the lower left corner is at position 0,0, and the upper right hand corner is at position 4,8. Put your second initial in a box where the lower left hand corner is at position 5,0, and the upper right is at position 9,8. That will leave one "point" of space between the two capital letters.
Also create a initials.gnuplot file that will take the input from initials.dat and produce an output file called initials.png. Adjust the xrange and yrange in your gnuplot file appropriately.
Make a directory called ~/public_html/cisc181/lab03, and copy your initials.dat, initials.gnuplot and initials.png files into that directory. Make the directory and all the files inside it readable with a "chmod" command. Your TA will look in that directory for the finished work.
Make sure you can see initials.dat, initials.gnuplot and initials.png when you go to http://copland.udel.edu/~userid/cisc181/lab03 (where userid is replaced with your userid).
Writing a .dat file and a .gnuplot file by hand can be tedious. If we are going to plot a large graphic, we might want to write a program to do it instead. In step 3, we'll do just that.
| Files you will copy from my web page: | none for this step |
|---|---|
| Files you will create and submit to the TA (also print ones in bold) | lab03pent.cc, lab03star.cc, lab03.txt |
| Files you will create and make available on the web | ~/public_html/cisc181/lab03/pentagon.png, ~/public_html/cisc181/lab03/star.png |
In step 2, you saw how to use gnuplot to plot points that you entered by hand using emacs or vi to create a data file (e.g. initials.dat).
Now, you will write two programs, lab03pent.cc and lab03star.cc. lab03pent.cc will draw a pentagon, while lab03star.cc will draw a five pointed star.
Both the pentagon and the star will be contained within a circle centered at the origin, with a radius of r units. (Prompt the user to enter a value for r at the beginning of the main function). You won't be drawing that circle of radius r, but you will be using that circle as a "reference" for plotting the points.
In both cases, you need to locate five points on the x,y plane. The first point will be at (0,r). On the unit circle (remember trigonmetry?) this point is at 90 degrees (or ![]() /2 radians). The other four points will be at angles of 360/5 degrees around the circle from this point (or 2
/2 radians). The other four points will be at angles of 360/5 degrees around the circle from this point (or 2![]() /5).. You can use trigonmetry to determine the x,y coordinates of these points (sin(), cos(), etc.... .remember SOHCAHTOA?). Consult your textbook on details of using #include <cmath> to access the sin() and cos() functions (remembering to use radians rather than degrees).
/5).. You can use trigonmetry to determine the x,y coordinates of these points (sin(), cos(), etc.... .remember SOHCAHTOA?). Consult your textbook on details of using #include <cmath> to access the sin() and cos() functions (remembering to use radians rather than degrees).
In both lab03pent.cc and lab03star.cc, you'll open an external file inside the C++ program (with ofstream). (You learned about using ofstream in lab02.) For lab03pent.cc, call this file "pentagon.dat". Write out the five points to this file, in order, and then write the first point at the end again (to close up the pentagon). Then, close the pentagon.dat file, and open another external file (you'll need a second ofstream object) called "pentagon.gnuplot". Use the A.gnuplot and CIS.gnuplot from lab03 as a model. Write out the contents of pentagon.gnuplot using C++ stream insertion operators. Set the xrange and yrange appropriately so that the entire pentagon is visible in the output file.
Then, create a shell script file penatgon.sh, similar to the following:
#!/bin/sh #pentagon.sh (your name here, date here, section number here) TARGET=$HOME/public_html/cisc181/lab03 gnuplot pentagon.gnuplot mkdir -m 755 -p $TARGET cp pentagon.png $TARGET chmod -R 755 $TARGET |
After you create this script (with a text editor), use this command to make it executable:
chmod u+x pentagon.sh
The chmod command just makes the file executable—you only have to do that once. That command does not, however, run the script. To run the script, you "execute" it in the same way that you run an executable program—by typing the filename at the command line. You may have to preceed it with ./ if the current directory is not in your path, for example:
./pentagon.sh
For lab03star.cc, you'll be writing out the points in a way that draws a star. Call your output file "star.dat". Define two functions called:
double xStarPoint(int pointNum, double radius);
double yStarPoint(int pointNum, double radius);
The function xStarPoint() will take a point number on the star (where point 0 is the first point, point 1, is the second point, etc. through point 4) and the radius of a circle, and then calculate a point on that circle (using trig functions). The function yStarPoint() does the same thing for the y coordinate.
(Note that when we write "xStarPoint()" with the empty set of parentheses as part of standard english text, this is a convention understood among C, C++ and Java programmers as a way of indicating in text that "xStarPoint" is the name of a function. It doesn't mean that xStarPoint() it is a function that takes no parameters. If we wrote "xStarPoint();" with an empty set of parentheses and a semicolon after it in a program, however, as a function call, that would mean that xStarPoint() takes no parameters.)
For the star, you need to connect point 0 to point 2, point 1 to point 3, point 2 to point 4, etc., all the way around the circle. You may find that the % operator is useful for doing this in a loop (mod, or "remainder after division").
You should write the program in such a way that the number of points in the star can be changed by only changing a #define, or a constant. Don't "hard code" for just 5 points. It is possible to do this without using arrays, though if you want to use arrays, that's ok.
When you have finished writing the points, close the output file. Then, n generate the gnuplot script (star.gnuplot) by also opening as an output file, and writing it out with stream insertion operations. Set the xrange and yrange appropriately, e.g. if the radius r is 10, use [-10,+10] or [-11,+11] so that the entire star appears in the output.
lab03.txt that covers both the lab03pent.cc and lab03star.cc programs.lab03.txt, do the following steps:
lab03pent.cc filelab03pent.cc file, but don't run it yetpentagon.dat", "pentagon.gnuplot", and/or "pentagon.png" files from previous steps, and then do an ls commandlab03pent executablecat your pentagon.dat, pentagon.gnuplot, and pentagon.sh files pentagon.sh shell scriptls command to show that pentagon.dat, pentagon.gnuplot and pentagon.png now exist.lab03star.cc file (substituting "star.dat", "star.gnuplot", "star.png" and "star.sh" as needed)http://copland.udel.edu/~userid/cisc181/lab03
| Points | What/Where | Issues to check |
| 20 | step 1: CISC181 web page | Make sure your web page comes up at http://copland.udel.edu/~userid/cisc181 |
| 20 | step 2 (getting used to gnuplot) | Make sure you can see initials.dat, initials.gnuplot and initials.png when you go to http://copland.udel.edu/~userid/cisc181/lab03 (where userid is replaced with your userid). |
| 50 | step3 (lab03star.cc, lab03pent.cc and lab03.txt) | 20 points for style, 20 points for correctness, and 10 points for following instructions. Make sure you can see star.png and pentagon.png when you go to http://copland.udel.edu/~userid/cisc181/lab03 (where userid is replaced with your userid). Make sure that the star.png and pentagon.png file both appear when you click on them. |
| 10 | following instructions in general | completing all steps per instructions on this web page and general course policies, putting your name, section and "lab03" on your printout, stapling it together neatly, giving your TA a printout during the lab etc. |