|
|
Expedition
Expedition | People
|
Log - August-14-2003
by Robert McCarthy
Previous | Next
The Strongest Fictitious Force “Around”
Robert McCarthy |
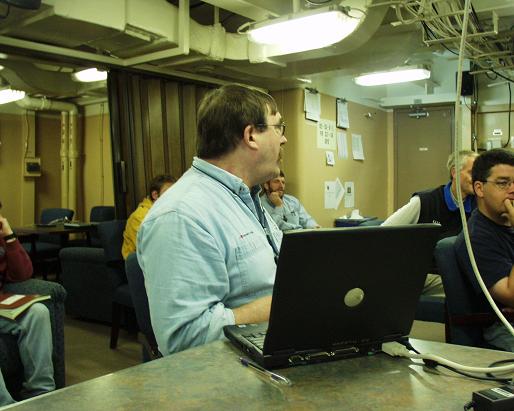 |
We are fortunate to have a meteorologist on the Healy with us. So much of the research plans depend upon sea state and ice motions, that having a meteorologist is essential. That meteorologist is Ed Hudson from the Prairie Aviation and Arctic Weather Center, Meteorological Service of Canada. Ed has proven himself to be very helpful to Gerhard and me, by giving us pictures to use, and feeding me excellent information and references that I used in some of my log entrees. Plus his wit and friendly personality has endeared him to all on board. I look forward to his daily weather predictions at our science meetings. |
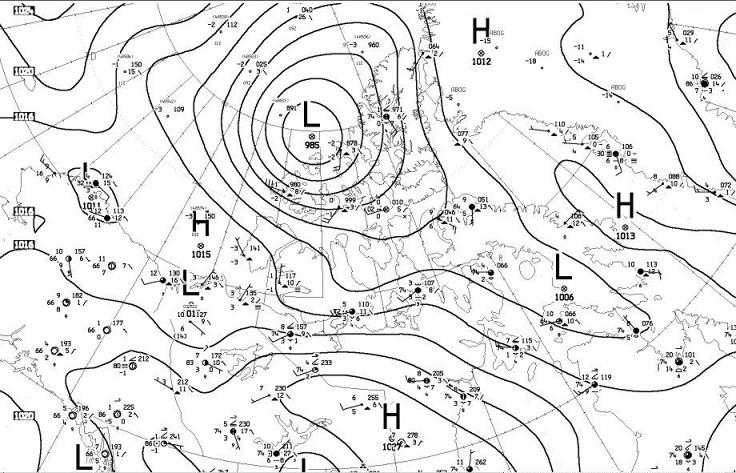
| Today I want to explain a simple weather map. On any TV weather report you will probably see a map with High and Low Pressure centers with circles drawn around them. (See the weather map, courtesy of Ed Hudson.) Why circles, and how can meteorologists use them to determine which way and how strong the wind will blow? |
| First let’s talk about pressure and the atmosphere. If I have a high-pressure tank and I open the valve, the air rushes out. (The low-pressure air does not rush in and force the high pressure out.) Thus air moves from high to low pressure regions. Low-pressure systems form when surface air rises, creating a partial drop in pressure which forces surface air to rush in a fill the void. Where air aloft sinks to the earth, this is a high-pressure region, since the earth’s surface forces this air to move away in all directions. So again, why are there circles drawn around high and low pressures, and not straight lines? |
 |
| Enter the French mathematician G. G. Coriolis in 1835. He demonstrated that since we are on a rotating frame of reference, we must introduce a fictitious force in the equations of motion if we want to explain motion on a fixed coordinate system. Let me try to explain with a simple example. |
| Let’s say that you are at the North Pole, and you fire an arrow directly south and aim for Pennsylvania. While the arrow is in the air, the earth continues to rotate on its axis from west to east, so that by the time the arrow lands, it hits California instead. You, having aimed carefully, explain this “miss” by stating that the arrow turned to the right in flight. (However, if you were on the moon watching the same motion, you would have seen the arrow fly straight.) Here’s where the observer on the rotating frame of reference must introduce a fictitious force to account for the arrow’s deflection to the right in the Northern Hemisphere. (The same argument holds for the Southern Hemisphere, except that the deflection is to the left.) This fictitious force is called the Coriolis force and its horizontal component is a maximum at the poles, and decreases to zero at the equator. In fact, the strength of this force is proportional to the sine of the latitude. If you try to explain motion on the earth where the latitude doesn’t change appreciably (say the weather for a part of your state), then you can assume this force is constant on that part of the earth. This is known as an f-plane approximation. Otherwise, you must assume that the Coriolis force varies within your region (Beta-plane approximation). |
 |
| Now we can understand weather maps. The air wants to rush away from the High Pressure, and flow to the Low Pressure, but the air is deflected to the right in the Northern Hemisphere. So the air rotates in a clockwise direction around a High Pressure, and similarly, the air rushing into a Low Pressure area is bent in a counterclockwise path. (The directions of rotation around High and Low Pressure areas are opposite for the Southern Hemisphere.) Thus the circles you see are the lines of constant pressure (isobars), and this is how the wind blows. There is some ground friction, which hinders the deflection slightly, which I ignored for the present argument |
 |
And finally, how can meteorologists determine wind speed? They know the strength of the High and Low Pressure centers, and thus can map out different lines of equal pressure (isobars), or contours. Just like reading a bathymetric or contour map, the closer the lines of constant pressure are to each other, the greater the gradient. A steep drop-off has many bottom contours close together, so a strong wind has many isobars spaced close together. Now you know a little about the Coriolis force, and how to interpret a weather map. |
|