|
|
Expedition
Expedition | People
|
Log - August-8-2003
by Robert McCarthy
Previous | Next
No more "ball and rope"
Robert McCarthy |
 |
The Challenger Expedition was the first “Oceanographic cruise”. Their sole mission was to learn more about the
oceans. It lasted over 3.5 years, and traveled more than 110,000 km. (That’s more than 2.75 times the earth’s
circumference!) Back in those days, part of their mission was to measure how deep the oceans were. The procedure
was to lower a massive greased ball attached to a rope until the tension in the rope changed. This signified that
the ball was on the bottom, and then they would measure how much rope was spooled out. If the ball came up with no
sediment sticking to the grease, they realized that it didn’t hit the bottom, and that cast would be redone. Think
of how time consuming that must have been and with thousands of meters of rope overboard; it must have weighed more
than the greased ball, so determining when the tension changed must have been speculative at best. Plus, rope
would go off at an angle to the ship, so measurements were very crude. Even with all those drawbacks and
difficulties, the Challenger completed over 500 depth measurements throughout the world’s oceans. |
| Sound is very efficient in traveling through water, and its speed is roughly 1500 m/s, over 4 times as fast as
in air. (It’s interesting to note that our ears are keyed in to listening for sound in air. With our eyes closed,
if someone makes a noise, we can fairly accurately determine the location of that sound source by the time
differential between our two ears. However, the same “experiment” in water, because of the sound differential
being smaller, is not as accurate in determining the direction of the source.) The speed of sound in water is a
function of the temperature, salinity, and pressure, and there is a depth region in the oceans where sound travels
the fastest. This region is called the SOFAR channel, and whales have been known to transmit their songs through
this region for tens to hundreds of kilometers. Early in the 20th century, echo sounding became widely used to
measure the ocean depths. A sound signal was emitted from the ship, and they listened for the return signal from
the bottom reflection. Knowing the speed of sound in seawater, and the time of round trip travel (from the ship to
the bottom and back to the ship), the distance traveled by the sound wave was calculated. Then the depth of the
ocean at that location was just half this distance. These were termed “soundings”, and the mapping of the oceans
took a giant leap forward. However, the bottom information was limited to an area directly under the ship. |
 |
 |
Enter the “Sea Beam 2112”! The Healy is equipped with this instrument which is mounted to the ship’s hull.
This is a “multibeam bathymetric survey system”, which means that it sends a series of signals down with 128 beams
directed at different angles and maps the bottom in a 120 degrees swath perpendicular to the path of the vessel.
Roger Davis with the University of Hawaii is the Sea Beam expert on the ship. He showed me the manual, and
although I didn’t study it, the physics resembles diffraction of light by a narrow slit. The sensors are looking
for constructive interference, which differ by an integer wavelength to the emitted signal, and regions of
destructive interference, where the return signal is a ˝ integer wavelength apart. The frequency of the emitted
signal is also of concern. Too high a frequency and attenuation (the reduction in amplitude due to frictional
losses) is a problem. The energy of the sound wave per unit of time is power, and power is proportional to
amplitude squared. Another concern is the signal to noise ratio. This measures the strength of the emitted signal
to the background noise and essentially is a measure of the detectability of the return signal. So there’s tons of
physics involved in generating the bottom bathymetry. |
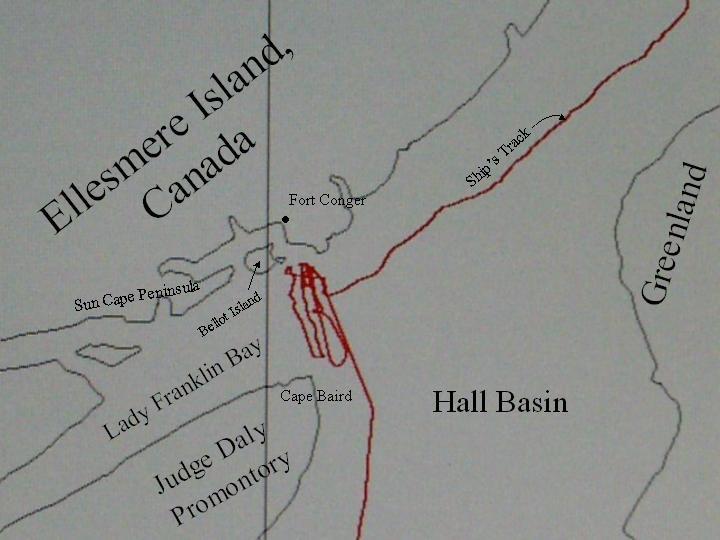
| This region between Greenland and Ellesmere Island is not heavily traveled by ships, and hence the maps of the
bottom are not so precise. The Healy did not get too close to land yesterday while the small boat operation was
looking for more clams. The bottom steeply sloped up towards land, and there could have been very shallow shoals
that would not appear on the nautical charts. So we stayed our distance, and ran parallel transits back and forth
to the entrance of Lady Franklin Bay. Basically we traversed between Fort Conger and Cape Baird (on the tip of
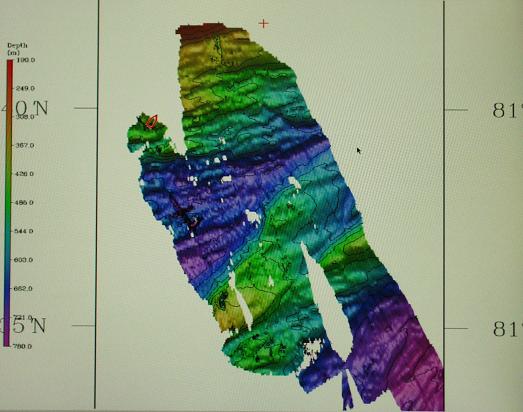
Judge Daly Promontory) to map the bottom while we waited for the dive team to return. Here is a color-coded map of
the bottom produced by the output of the Sea Beam. This map is the result of 5 ship transits, pieced together.
Notice the latitude: 81 degrees, 38 minutes in the center of the plot. That’s way-the-heck up here, and just a
little more to go to reach the Lincoln Sea. Here’s hoping! |
 |
|