|
|
Expedition
Expedition | People
|
Log - July-24-2003
by Gerhard Behrens and Robert McCarthy
Previous | Next
| Labrador Current |
| Today we passed into the Arctic Circle (Latitude 66 degrees, 40 minutes North), and we continue to have excellent weather. Seas have remained less than 5 feet. Now that we are north of the southern tip of Greenland, we are not too far away from land. Hence the fetch, the distance the wind can blow on the sea surface to generate waves, is fairly small. Think about blowing across the top of your mug to cool your coffee. Those little waves that are created are termed capillary waves, because the restoring force (the force that wants to return it to a flat surface) is surface tension. Sustained blowing will create larger waves termed gravity waves, because gravity becomes the restoring force. To generate very large waves you need high winds, a long time for them to interact with the waves, and a long fetch. So the waves we will experience now will be fetch-limited.
|
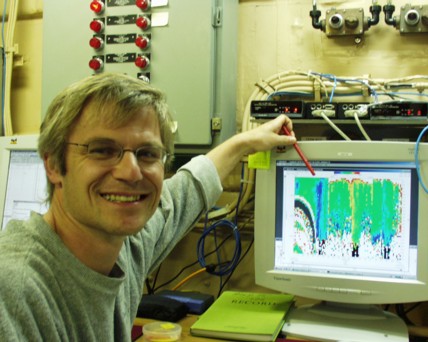 |
We passed through the Labrador coastal current as we steamed from St. JohnŐs, Newfoundland to our present location. The signature appeared on the data from the underway Acoustic Doppler Current Profiler (ADCP) which is mounted on the shipŐs hull. This instrument sends down an acoustic (sound) signal and measures the horizontal velocity of the water as a function of depth. The Doppler shifted return signal determines the velocity of the water (similar to how police use radar to determine the speed of a car). Also, you are familiar with the observed change in pitch when a train passes you; high frequency approaching, and a lower frequency leaving. Dr. Andreas Muenchow said the current was barotropic, which means that the flow did not reverse with depth. The strength decreases with depth (due to friction), but the whole water column was flowing in a Southerly direction at a velocity of about 1 knot. This flow is driven by a simple balance between pressure gradient of the sea surface slope and the Coriolis force which deflects motion to the right in the northern hemisphere. The sea surface is higher along the Labrador Coast, because fresh water is lighter than salt water, and there is a large influx of freshwater from streams, snow melt, and ice melt. This water would like to flow downhill, (i.e. straight off shore) but the Coriolis force deflects this water to the right, thus forming the Labrador Coastal Current. My diagram doesnŐt show this surface slope, but it is implied with the lighter shelf water meeting the saltier slope water. Being a former physical oceanographer, I am excited to be looking at these types of measurements again, and Dr. Muenchow is anxiously awaiting arriving at the designated stations.
|
|
Why are we doing science way up near the North Pole? That is a question lots of people asked when I told them I would be spending some of my summer vacation in the Arctic. Let's look at the Oregon Science Benchmarks for Science to see why the scientists are here, and what they are doing. The benchmarks for doing science work are in four parts.
|
 |
Part 1: You must have a scientific question that starts with
observations and science knowledge.
These observations start with knowing that the Arctic Ocean is very important to the health of our planet. Fresh water from rivers, glaciers, and fresh seawater sources mix with the colder, salty Arctic waters. All this mixing is very important to the health of the oceans and to our weather. But lately, scientists have observed changes in weather patterns, changes in current, and changes in the amount of fresh water. There is also less ice. Because of these changes, the scientists are asking these important questions: How can we understand more about what is causing the changes in the amount of fresh water in the Arctic? With the information we collect in Baffin Bay and the Nares Straight, can we make a good model of what will happen in the future?
|
 |
Part 2: You must design a study to help explain or understand the question.
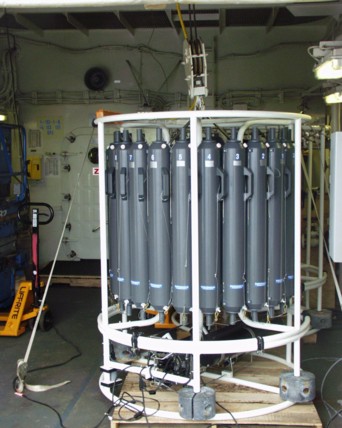
The team of scientists has 5 ways of helping them with their questions. One
way uses moorings. Moorings are instruments attached to a weight at the bottom of the ocean. It will record the current (speed), temperature, and saltiness of the ocean at different depths for the next 3 1/2 years. The second tool is a CTD rosette. It is on a cable and it picks up water samples at lots of places in the ocean. It will tell us the temperature, saltiness, and lots of other properties of the ocean water at different levels. The third tool is a clam! Just as tree rings can tell you about its growth and the weather, clams make layers on their shell, and those layers can tell you about the about their growth and the chemicals in the water for the last 30-50 years. A fourth tool is a sediment core. A very heavy steel pipe is driven into the ocean floor, and it takes a sample of the layers of mud and rock below the ocean floor. Even this mud can give clues to the weather patterns of the Arctic thousands of years ago. Finally, there are scientists getting information any time the ship is moving. There is a tool at the bottom of the ship that is making a map of the ocean bottom, a tool measuring the current speed and direction, and a tool for measuring temperature and saltiness of the surface water.
|
Part 3: You must collect, organize, and record what you find.
Some of this will happen on the ship, and some of it will have to happen in the science labs back home.
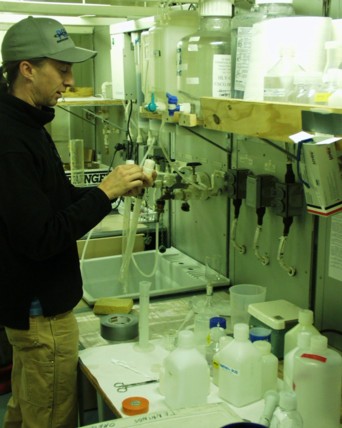
Right on the ship, one lab worker will check for a chemical called freon as soon as the samples come out of the water. Some one else will check for oxygen and different kinds of nutrients. Others will use computers and special recording sheets to organize the information we get from water samples. One team will check the mud from the ocean floor to see how magnetic it is.
In the science labs back home, the clamshells, the clams inside, the mud cores, and some of the water samples will be tested. Then, even more organizing and analyzing will take place as graphs, maps, and charts are made to show the information more clearly.
|
Part 4: You must look at all your information to explain
what you found
This is the hardest part. The scientist has to use what she knows about the oceans and what she has learned from these tests to see patterns or detect clues, always trying to understand more about the water. Next, the scientists must share what they found and explain what the new information means. They do that by writing reports and giving talks.
|
| This is a long way of saying that the Arctic is an important place to study, and that the way you do science in the classroom is exactly the way science is done on this research ship. |
|